Statistics plugin
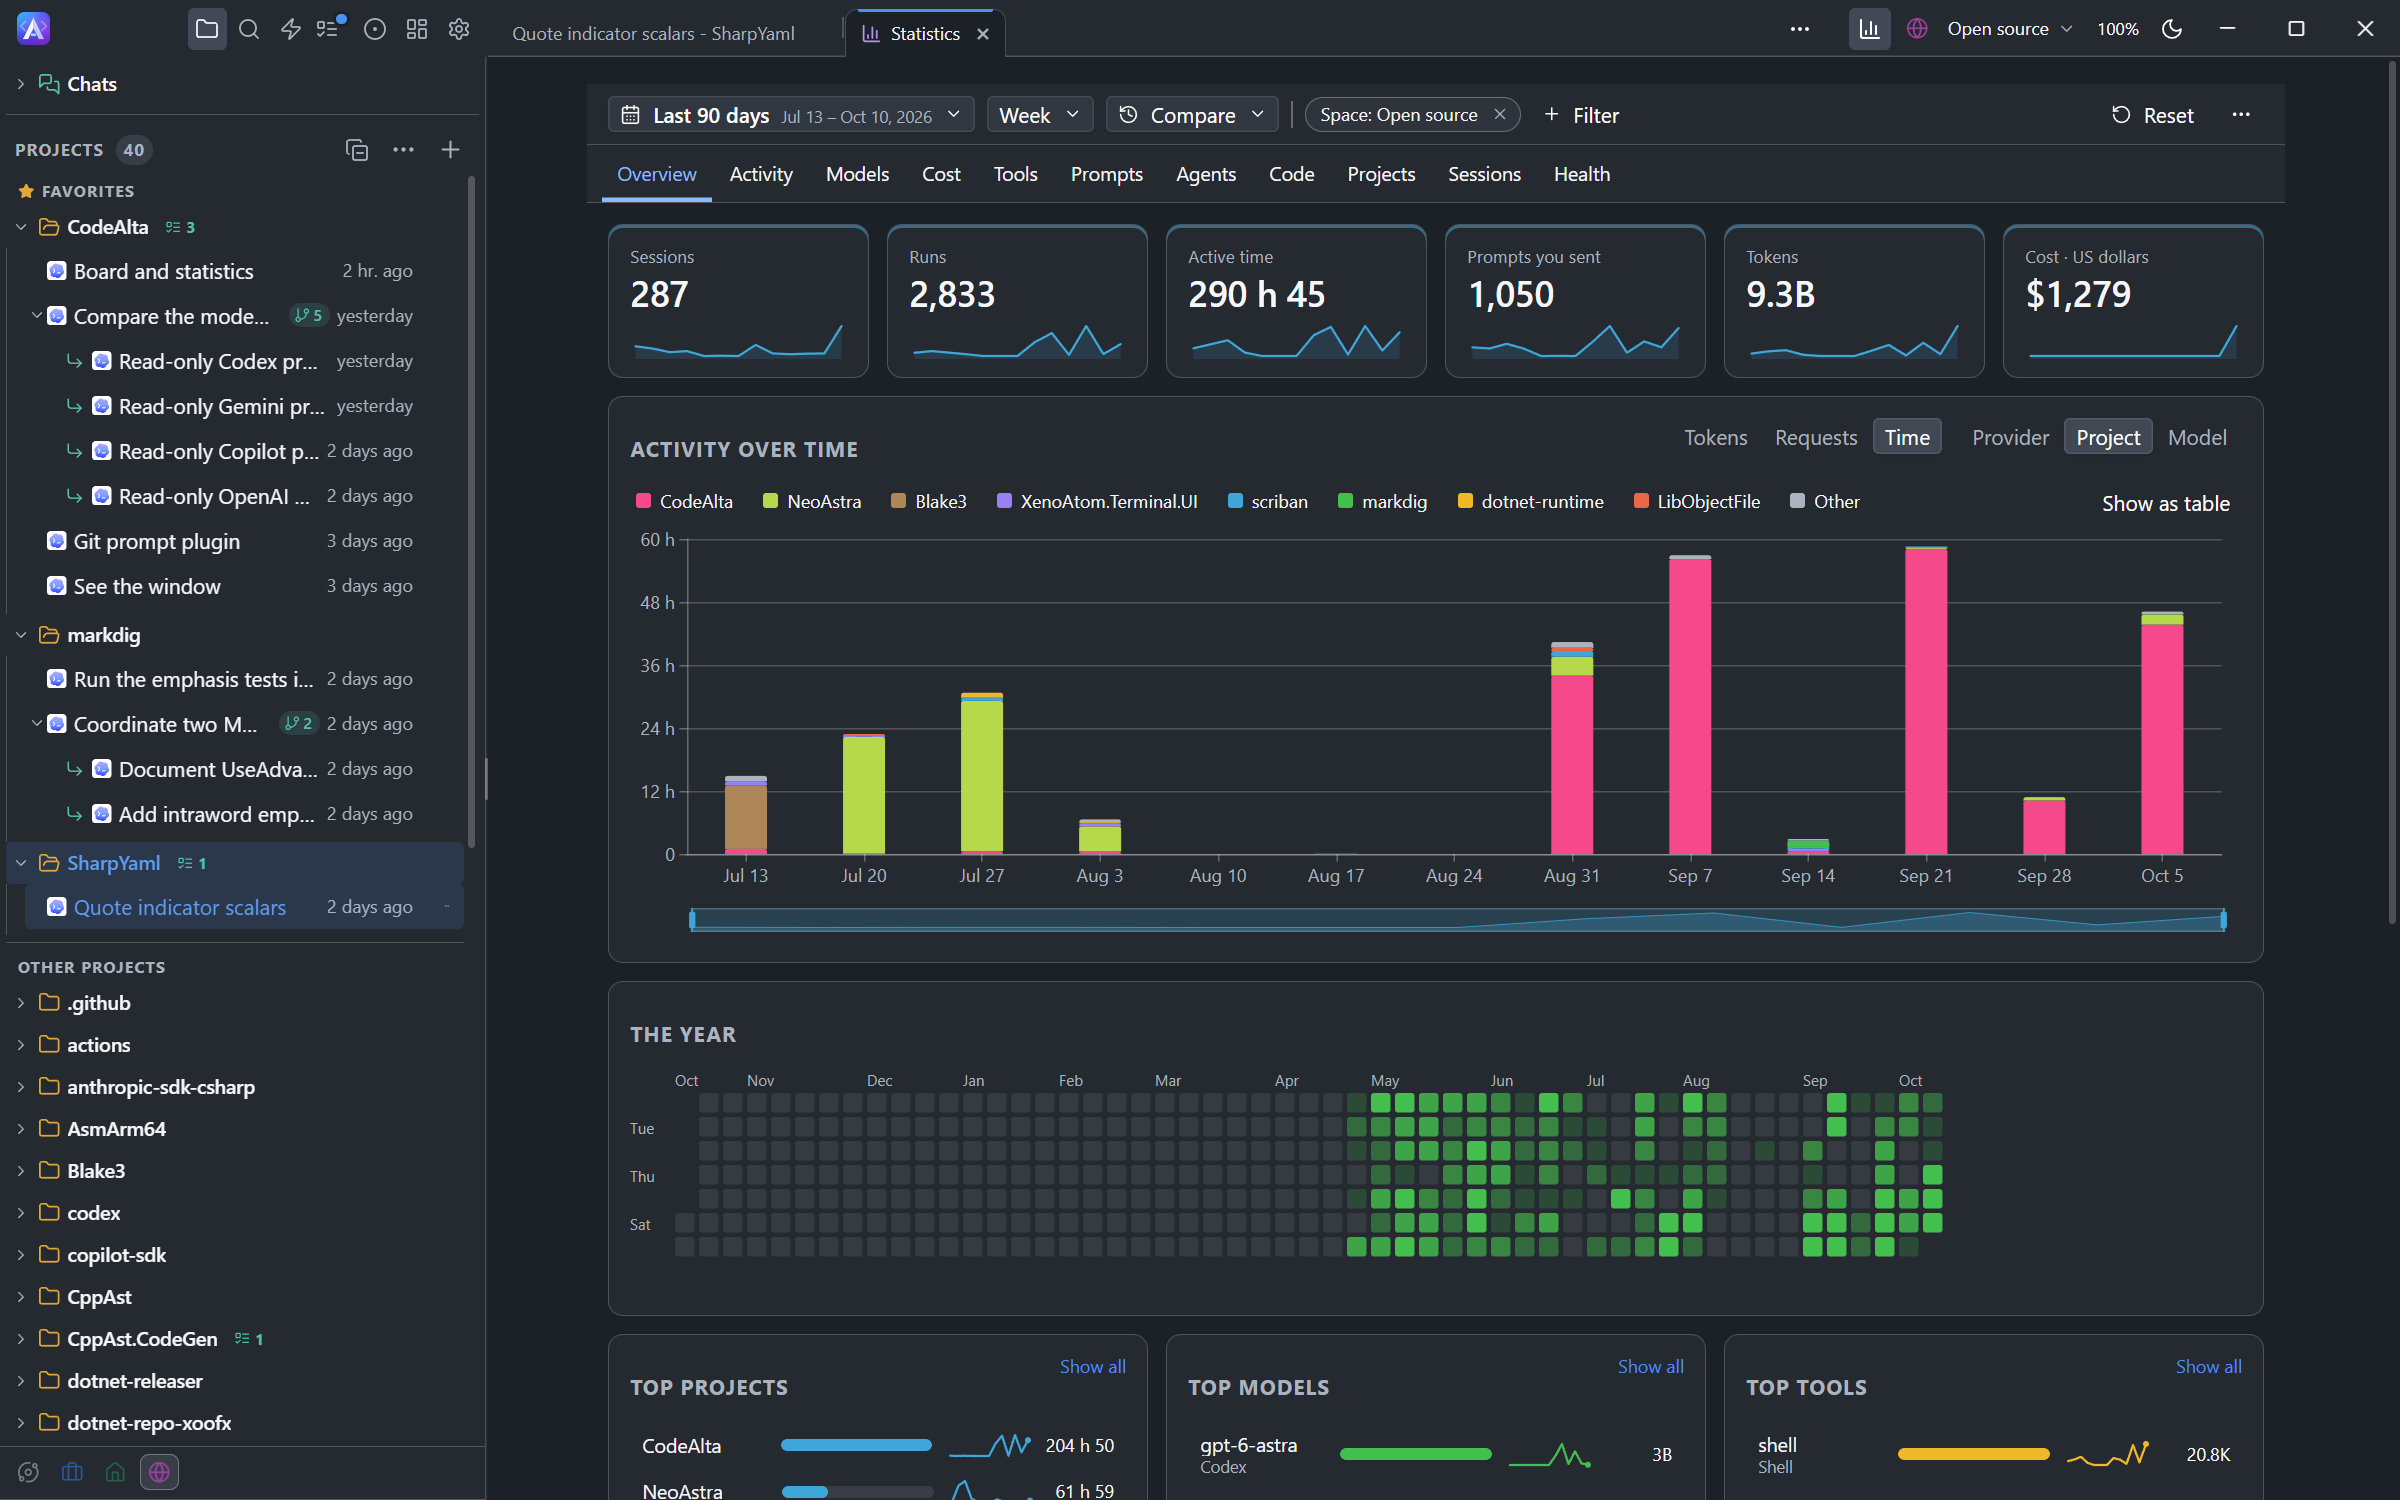
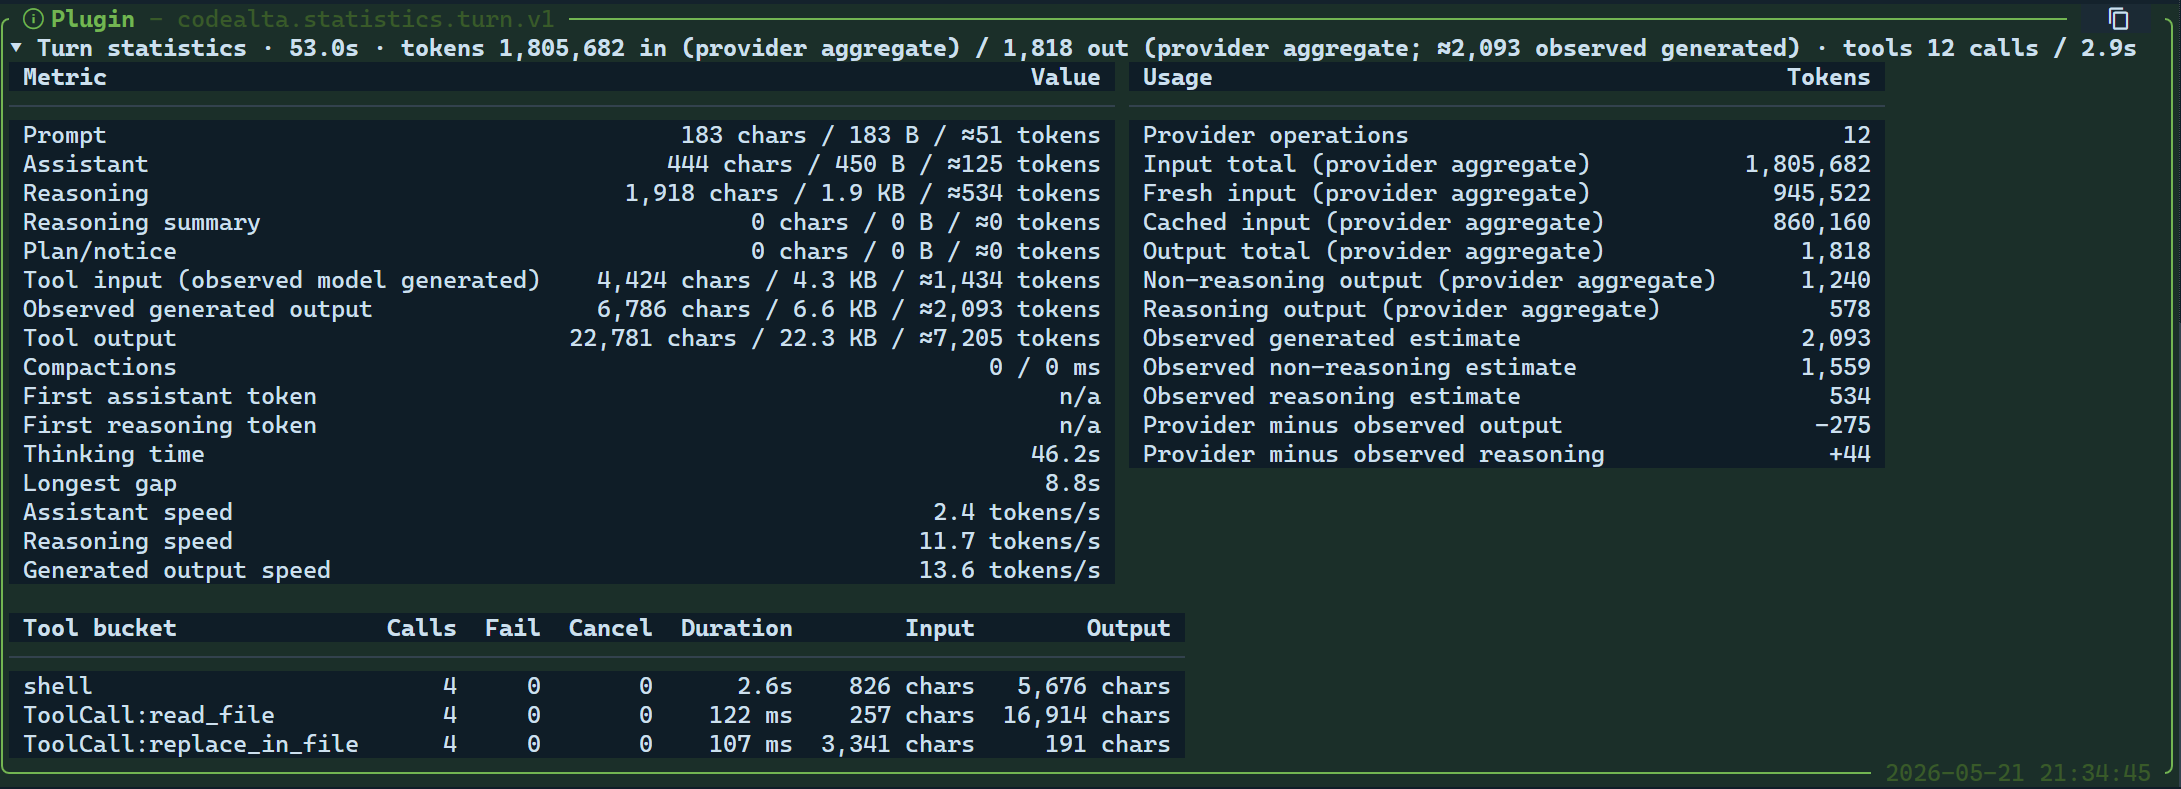
The built-in Statistics plugin shows how you use CodeAlta. It adds a statistics card to each turn, and CodeAlta Desktop keeps the numbers of all your sessions over time: sessions, runs, active time, prompts, models, tokens, tools, and the cost where a provider gives one.
What it adds
- A statistics card for each turn and session in the timeline. The card is derived from the session's records, not stored in the conversation.
- In CodeAlta Desktop, the Statistics page with the numbers of every session, kept up to date as sessions run.
- The
alta statisticscommands, which agents use to read the numbers and estimate the size of a text.
CodeAlta TUI has the cards and the commands, not the page.
Open the statistics
In CodeAlta Desktop the Statistics page opens in a tab:
| Where | How |
|---|---|
| Title bar | The Statistics button, before the space switch. A small ring while history is read; a dot while it waits for your choice |
| Keyboard | Ctrl+G, then C |
| Search | Statistics, or /statistics |
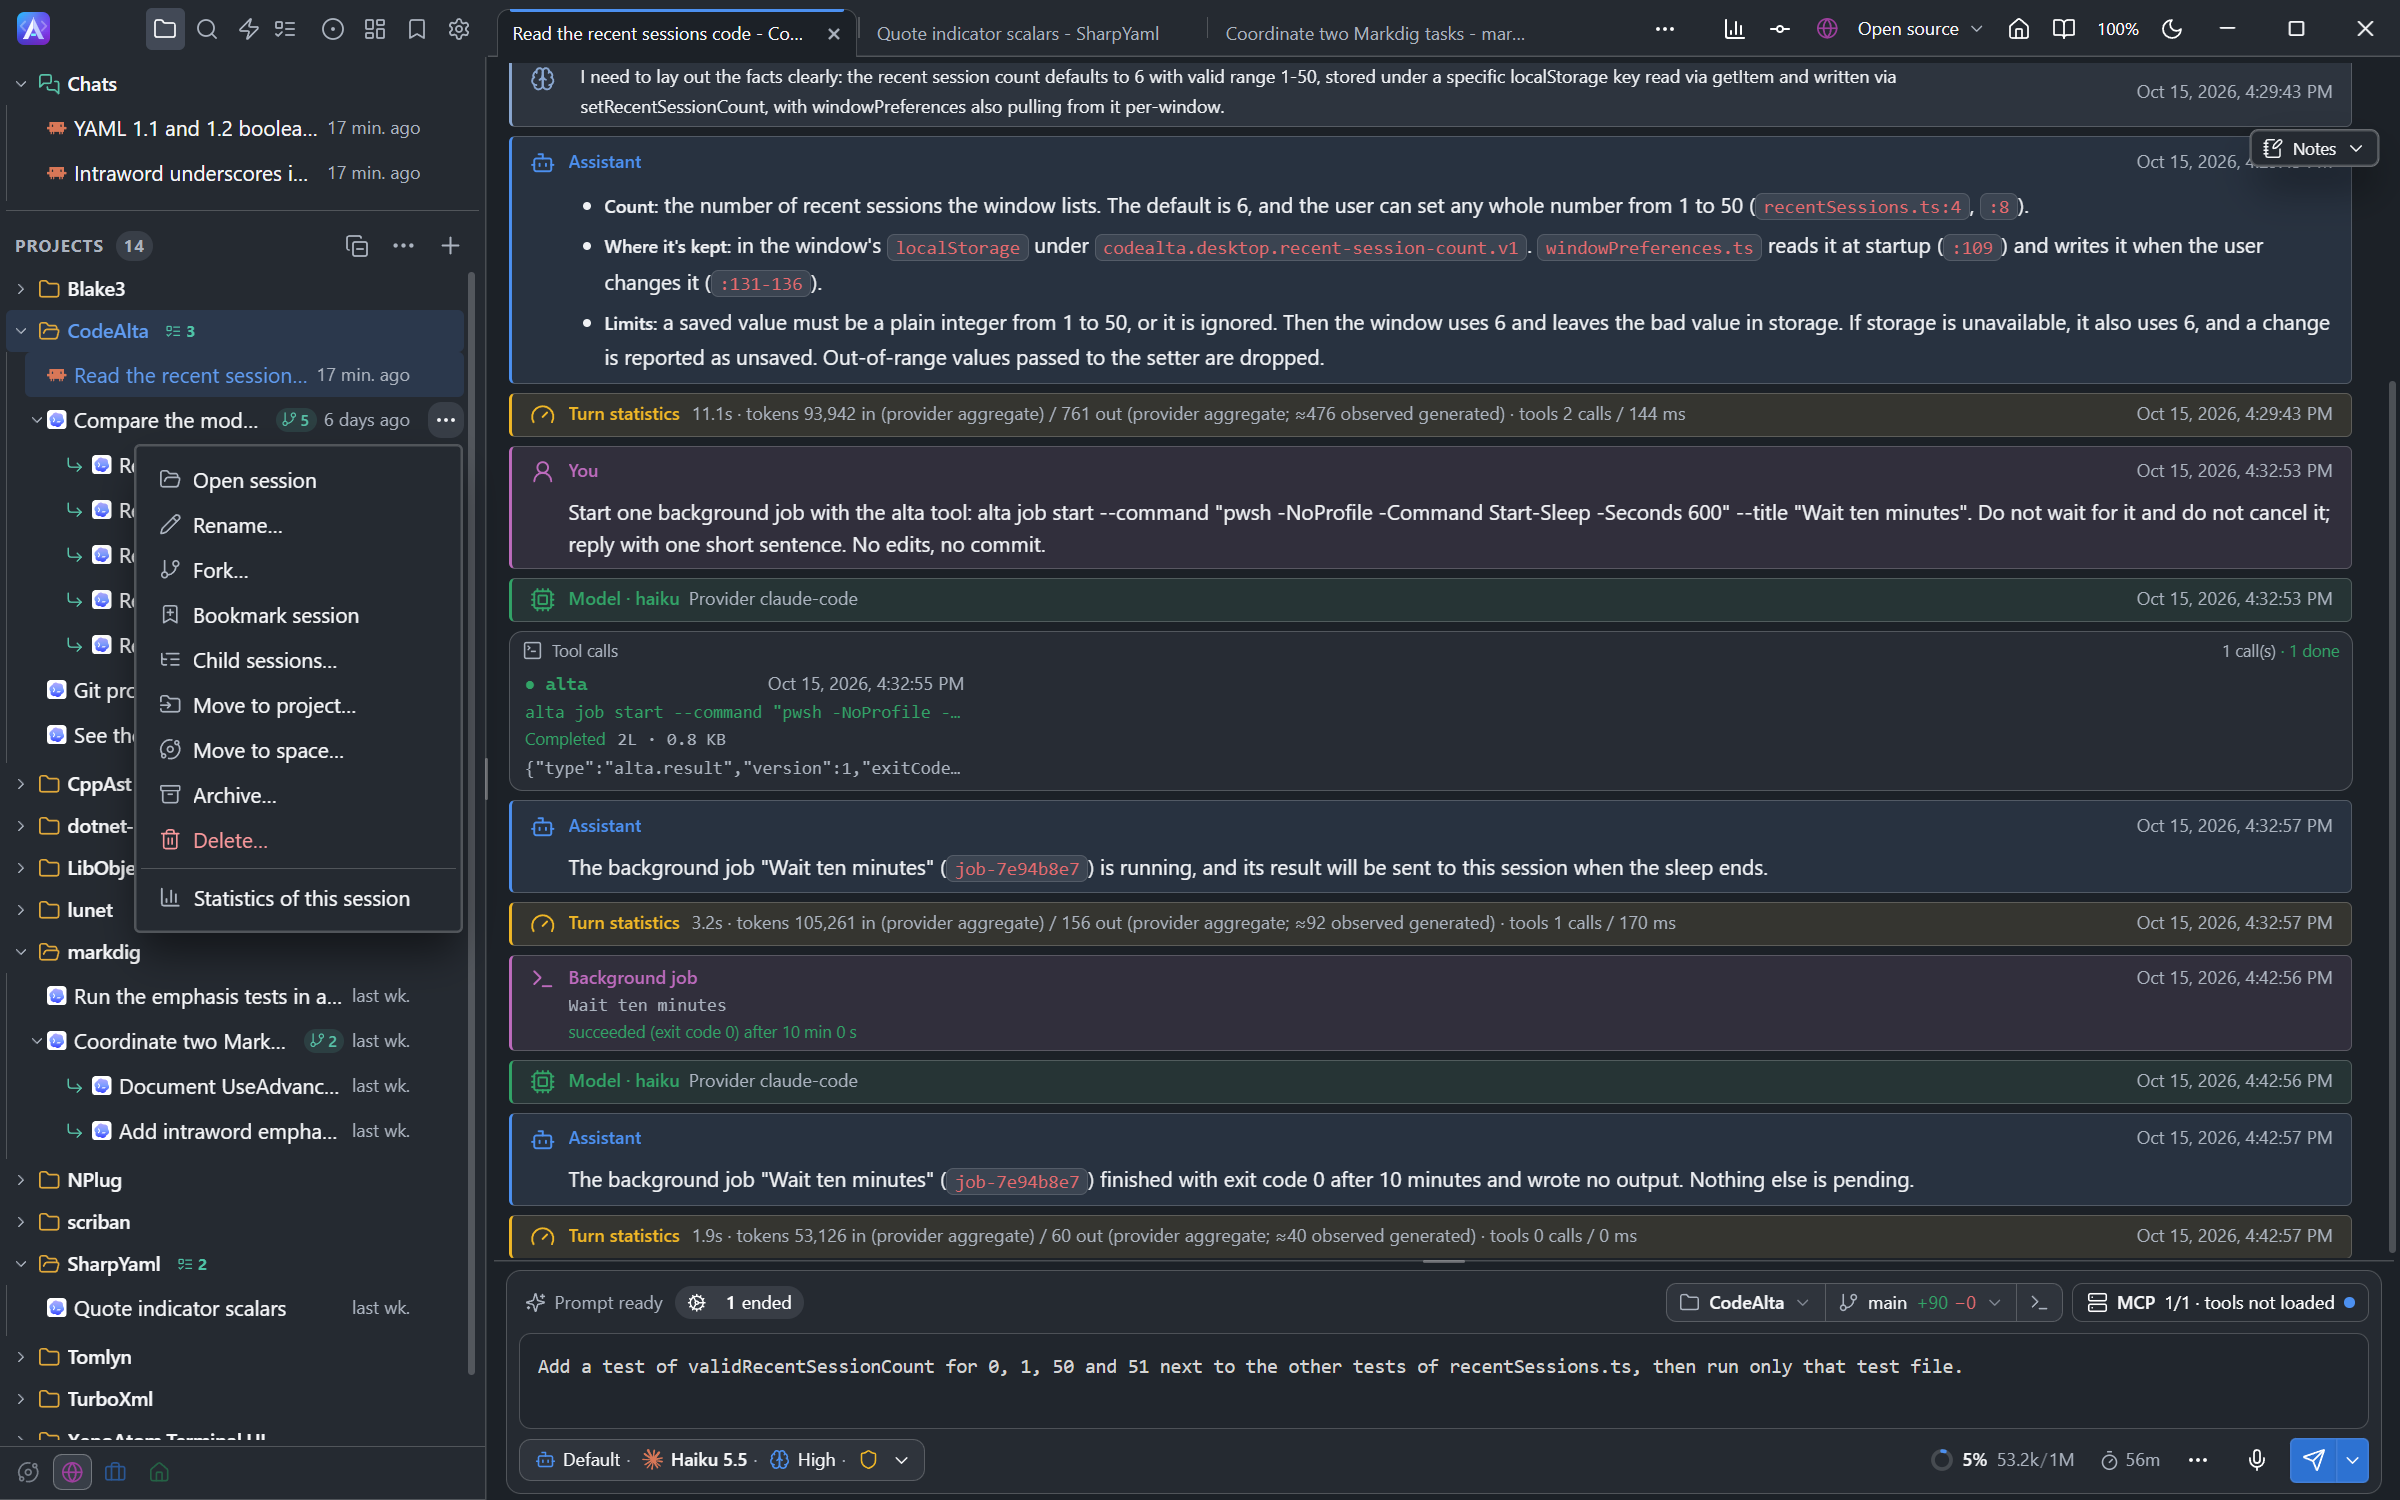
| A project | Statistics of this project in the project's menu: that project only, in its own tab |
| A session | Statistics of this session in the session's menu, or Session statistics at the foot of a turn card's details: that session and its sub-agents |
| An agent | alta canvas open statistics |
| Welcome page | The Statistics card shows the last seven days; Open Statistics opens the page |
- Each space has its own Statistics tab. A space counts its projects and its own chats.
- A session's page covers its whole life, with the sessions it created. Its name in the bar opens the session; Reset comes back to it after filtering.
- Open tabs refresh every 10 minutes by default. Refresh statistics updates now; Refresh every… in the Statistics menu chooses 1, 5, 10, 30 or 60 minutes, per tab. Recording never waits for a refresh.
- Last data update, above the Overview tiles, is the time of the stored data shown (Unavailable when unknown).
Reading your history
CodeAlta Desktop reads your sessions once, in the background, and keeps small counts: runs and their duration, models, tools, tokens, and file changes.
What is kept. Numbers, and a few names to tell them apart: providers, models, tools, skills, MCP tools, scripts and session titles. Never the text of prompts, answers or tool results. A file is counted by its extension; a command by its program name, never its arguments. A title is the first sentence of the first prompt, at most 80 characters, without words holding / or \. The numbers stay on your computer, and remain after a session is deleted.
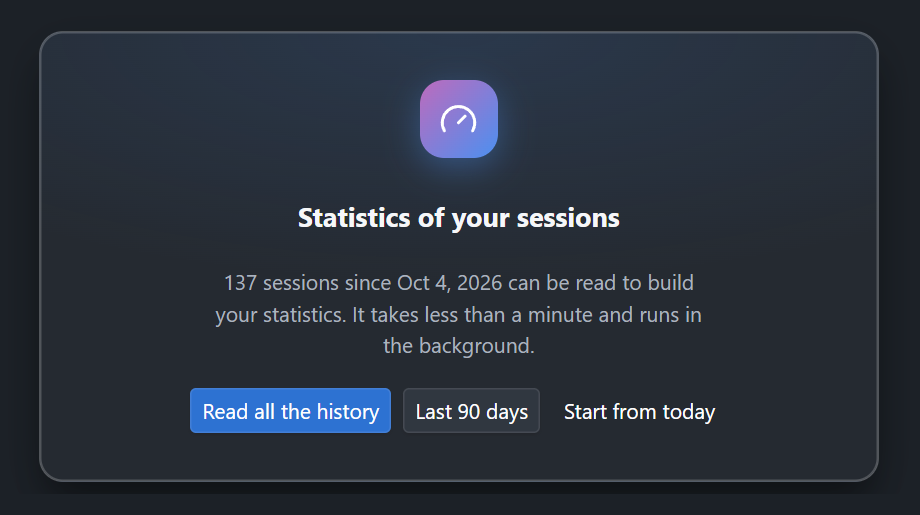
The first time, nothing is read until you choose:
| Choice | What happens |
|---|---|
| Read all the history | Every session, the most recent first. Usually well under a minute |
| Last 90 days | Sessions active in that time; the statistics start that day |
| Start from today | Nothing of the past; the statistics start now |
- Recent sessions come first, so today and this week are right within seconds.
- Reading runs on one low-priority thread and never slows a session. You can pause, resume, stop, and later read more.
- If CodeAlta closes, reading resumes at the next start; nothing read is lost.
- Sessions of CodeAlta TUI are caught up at start and every few minutes.
- When a new version computes more, sessions are read again one by one, and the old numbers stay until the new ones are ready. A deleted session keeps its recorded values.
- Coverage says when older sessions did not record a metric, rather than showing zero.
You can also ask from a prompt:
Read my statistics history for the last 90 days.
Pause the reading of my statistics history, and tell me how far it got.
Saved statistics
The facts of deleted sessions are kept in a separate archive, saved_statistics_after_deleted_sessions, in the state folder (~/.alta/, or ~/.alta/dev/ for a developer instance), beside a saved_statistics_after_deleted_sessions.initialized file.
- Reset statistics keeps this archive: it clears the reading choice and rebuilds the charts from saved facts.
- Forget deleted sessions removes only facts not yet saved in the archive. There is no button to purge the archive.
- Keep the folder and the
.initializedfile in your backups, and never delete the file to work around a problem. - If the archive is missing, damaged or not writable, CodeAlta refuses to reset statistics or to allow automatic session cleanup until it is repaired.
The Statistics page
One tab for each question:
| Page | The question it answers |
|---|---|
| Overview | How much did I use CodeAlta, and on what? |
| Activity | When do I work, how long do runs take, how many sessions run at once? |
| Models | Which providers, models and efforts, for how many tokens, and how full does the context get? |
| Cost | What did it cost, where a cost is known? |
| Tools | Which tools, skills and MCP tools are used, how long do they take, how often do they fail? |
| Prompts | How much do I write, and how much do agents write to each other? |
| Agents | How much work goes to sub-agents, how deep, and what do automations, reminders and CodeAlta itself start? |
| Scripts | How much work runs as Code Mode scripts, which scripts, how they end, and what their sessions cost? |
| Code | How many files and lines changed? |
| Projects | Which projects and spaces take the work? |
| Sessions | The sessions of the period, sortable, each opening its session |
| Health | Errors, interrupted runs, compactions, context fill |
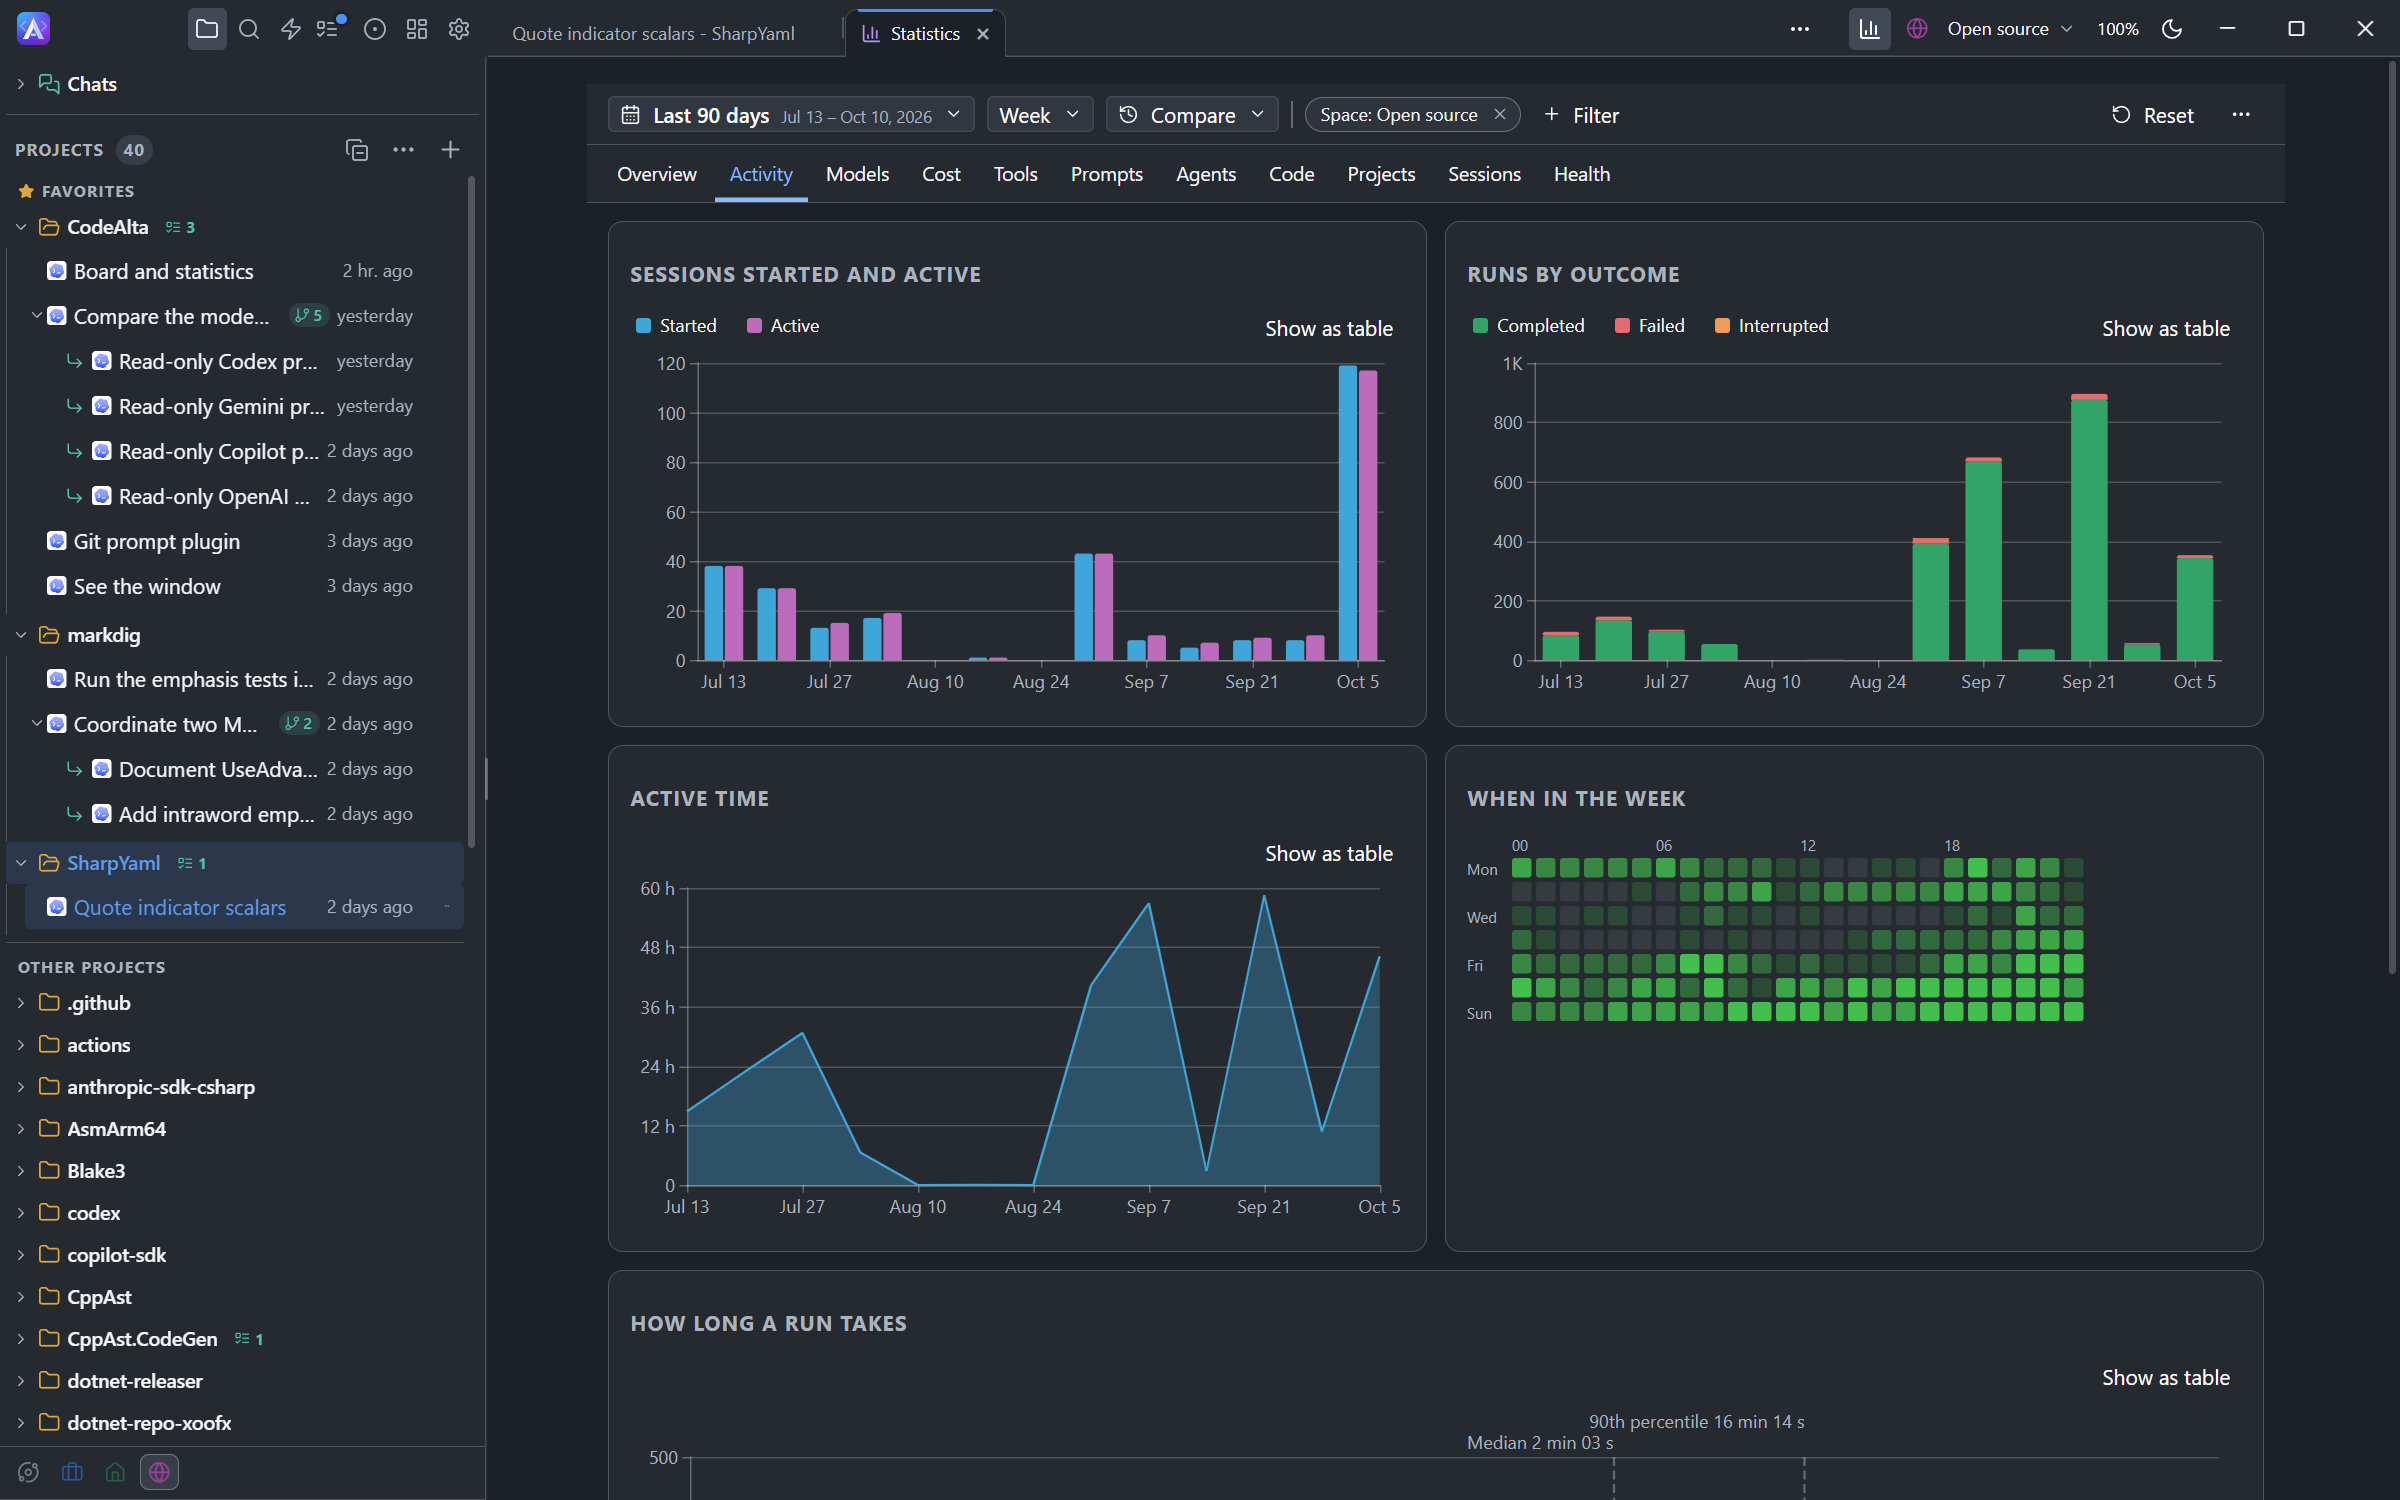
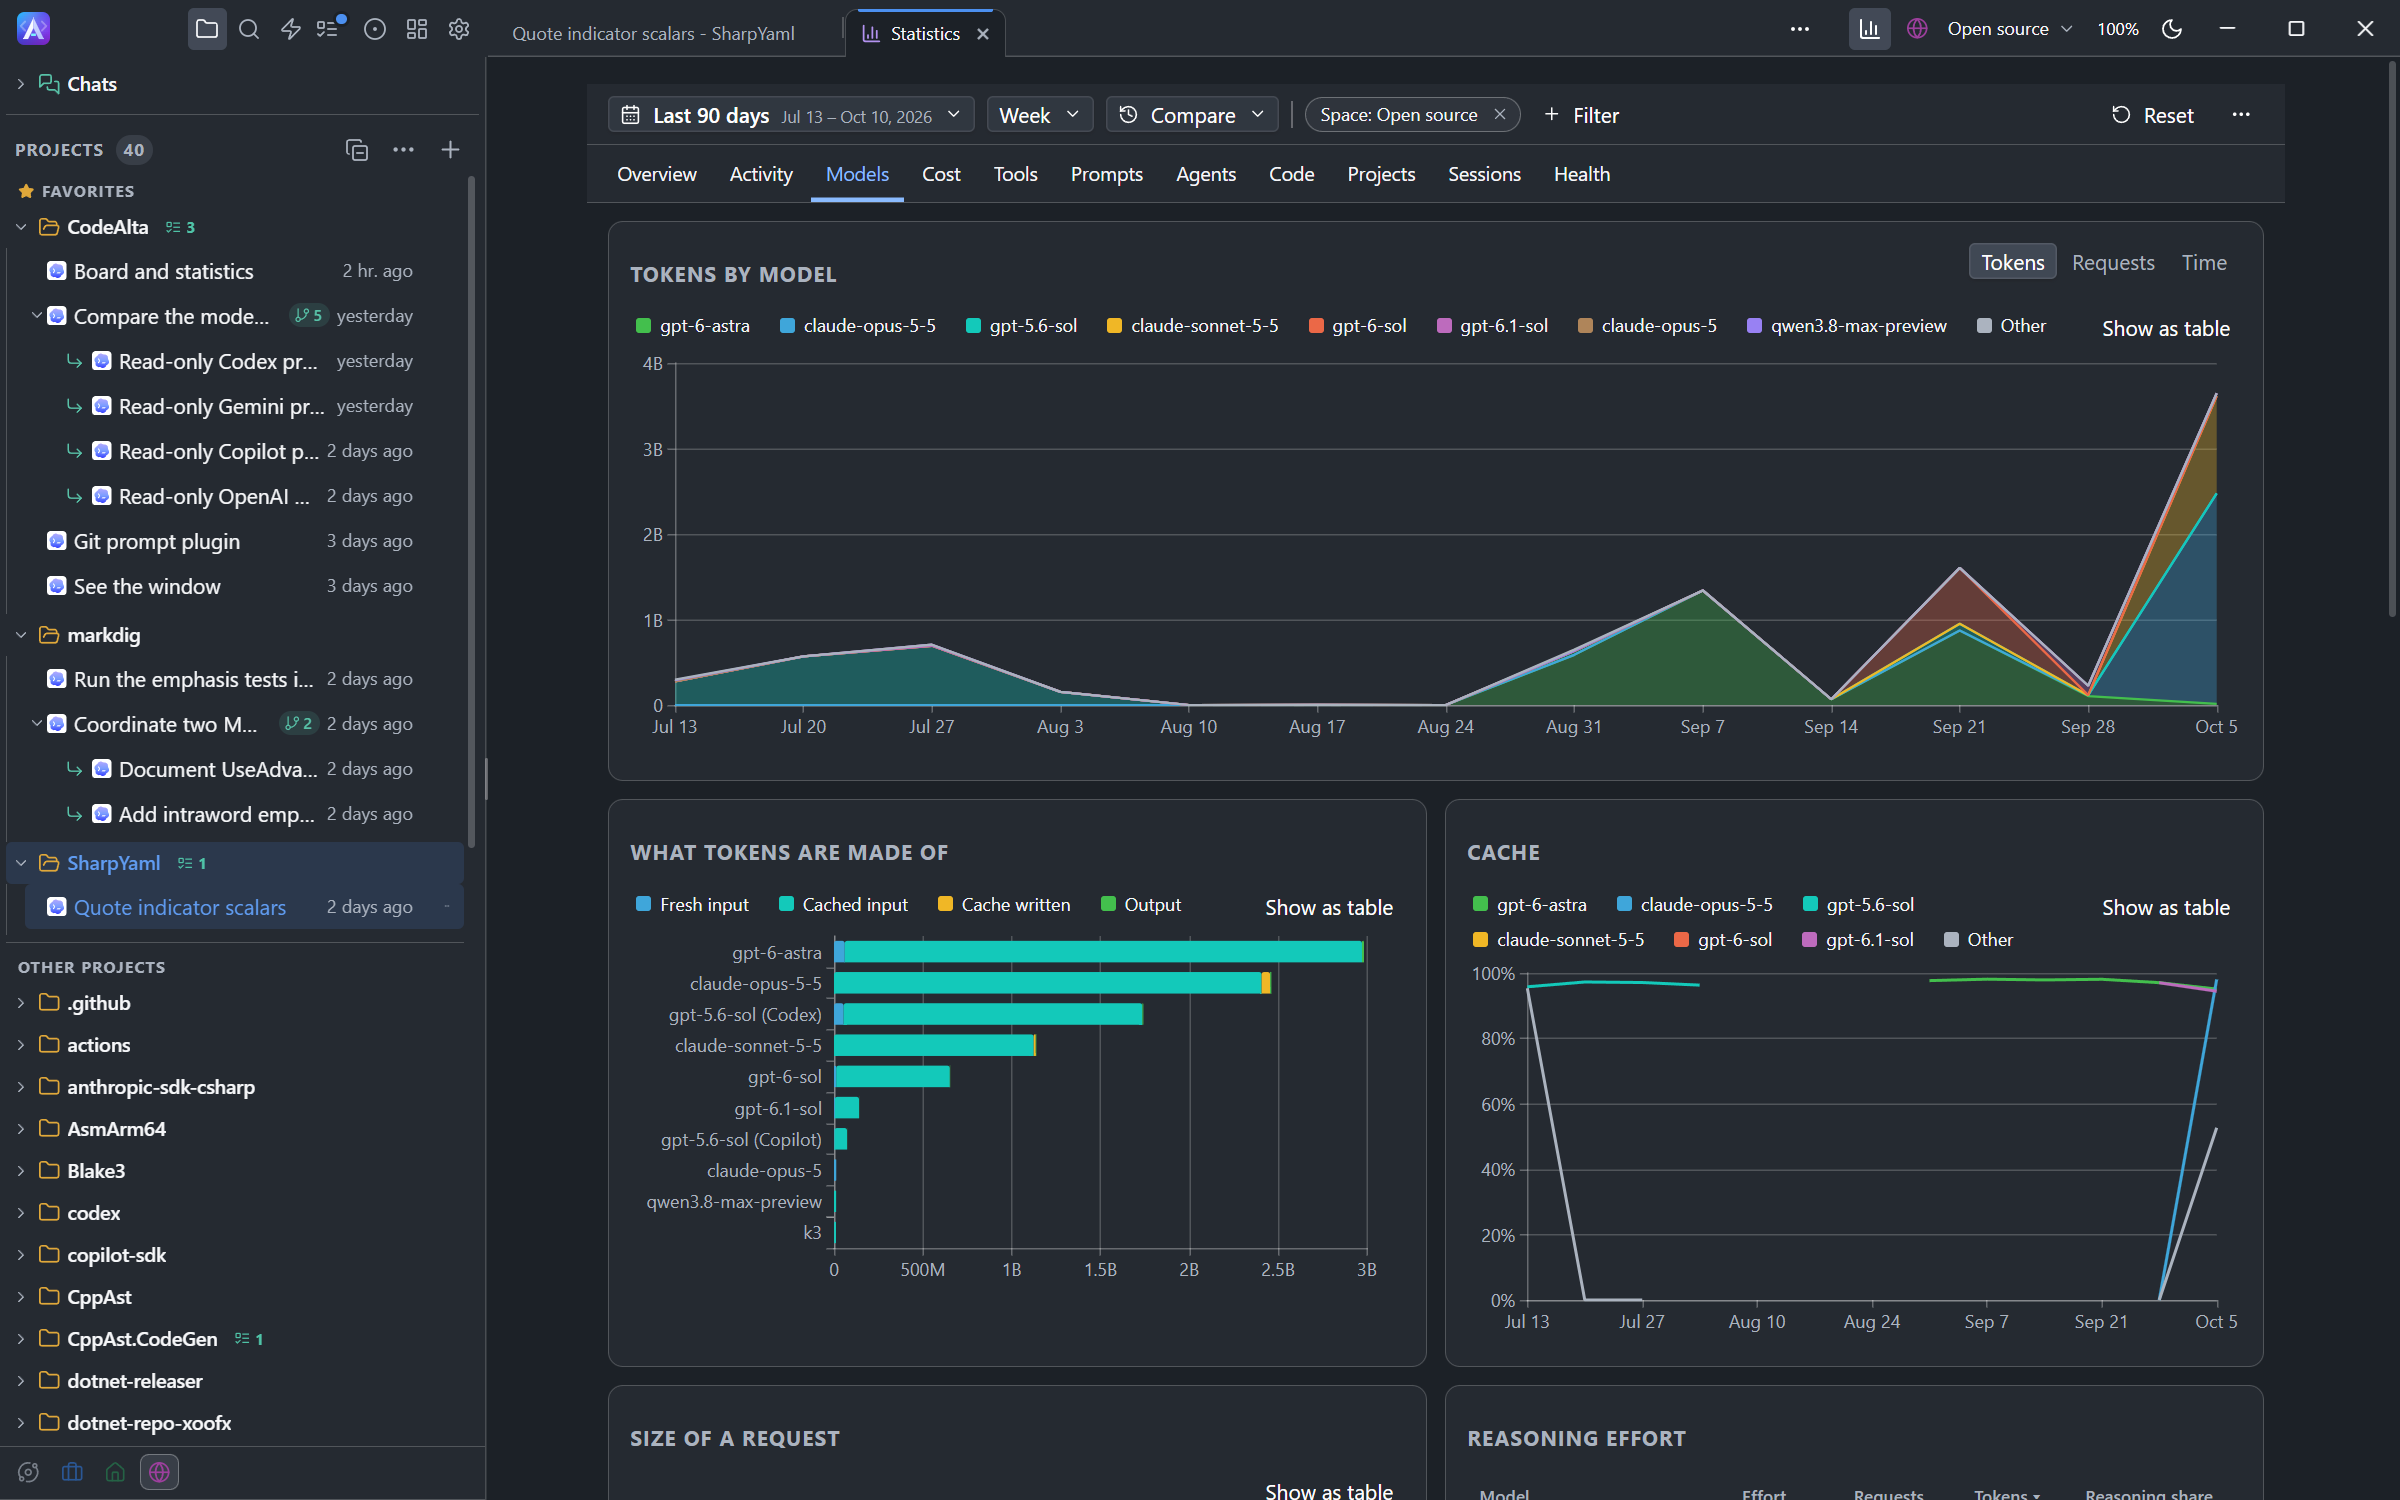
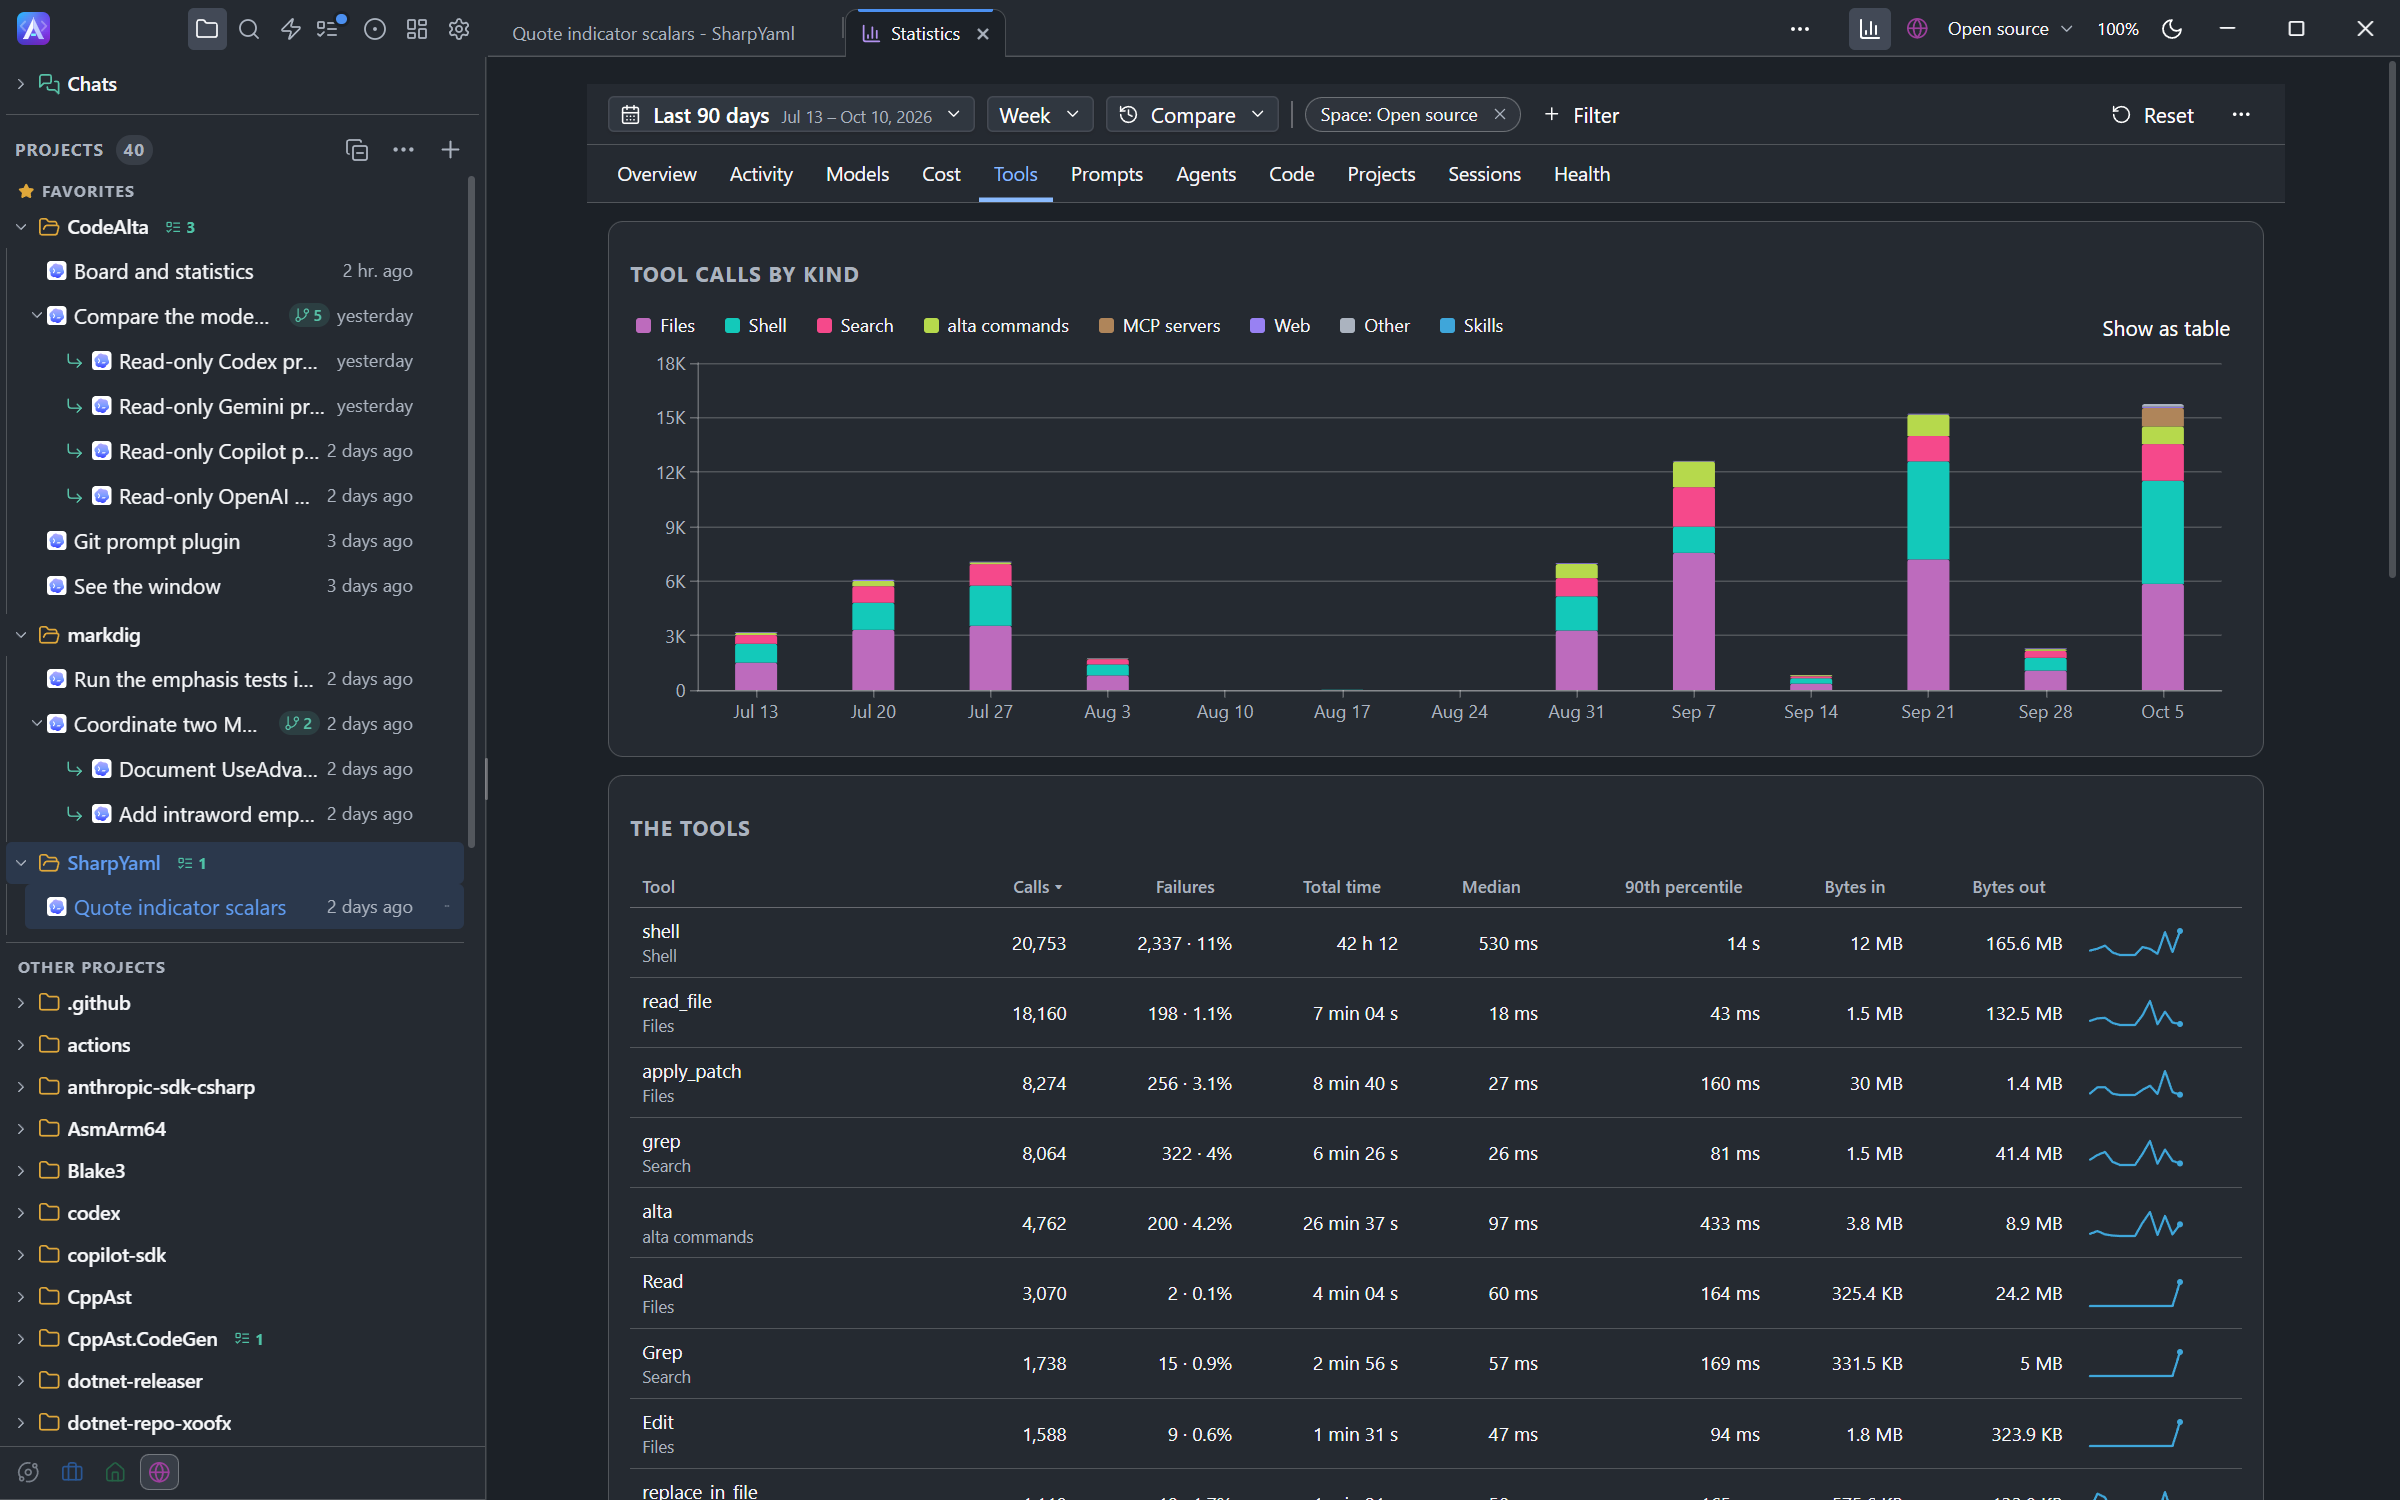
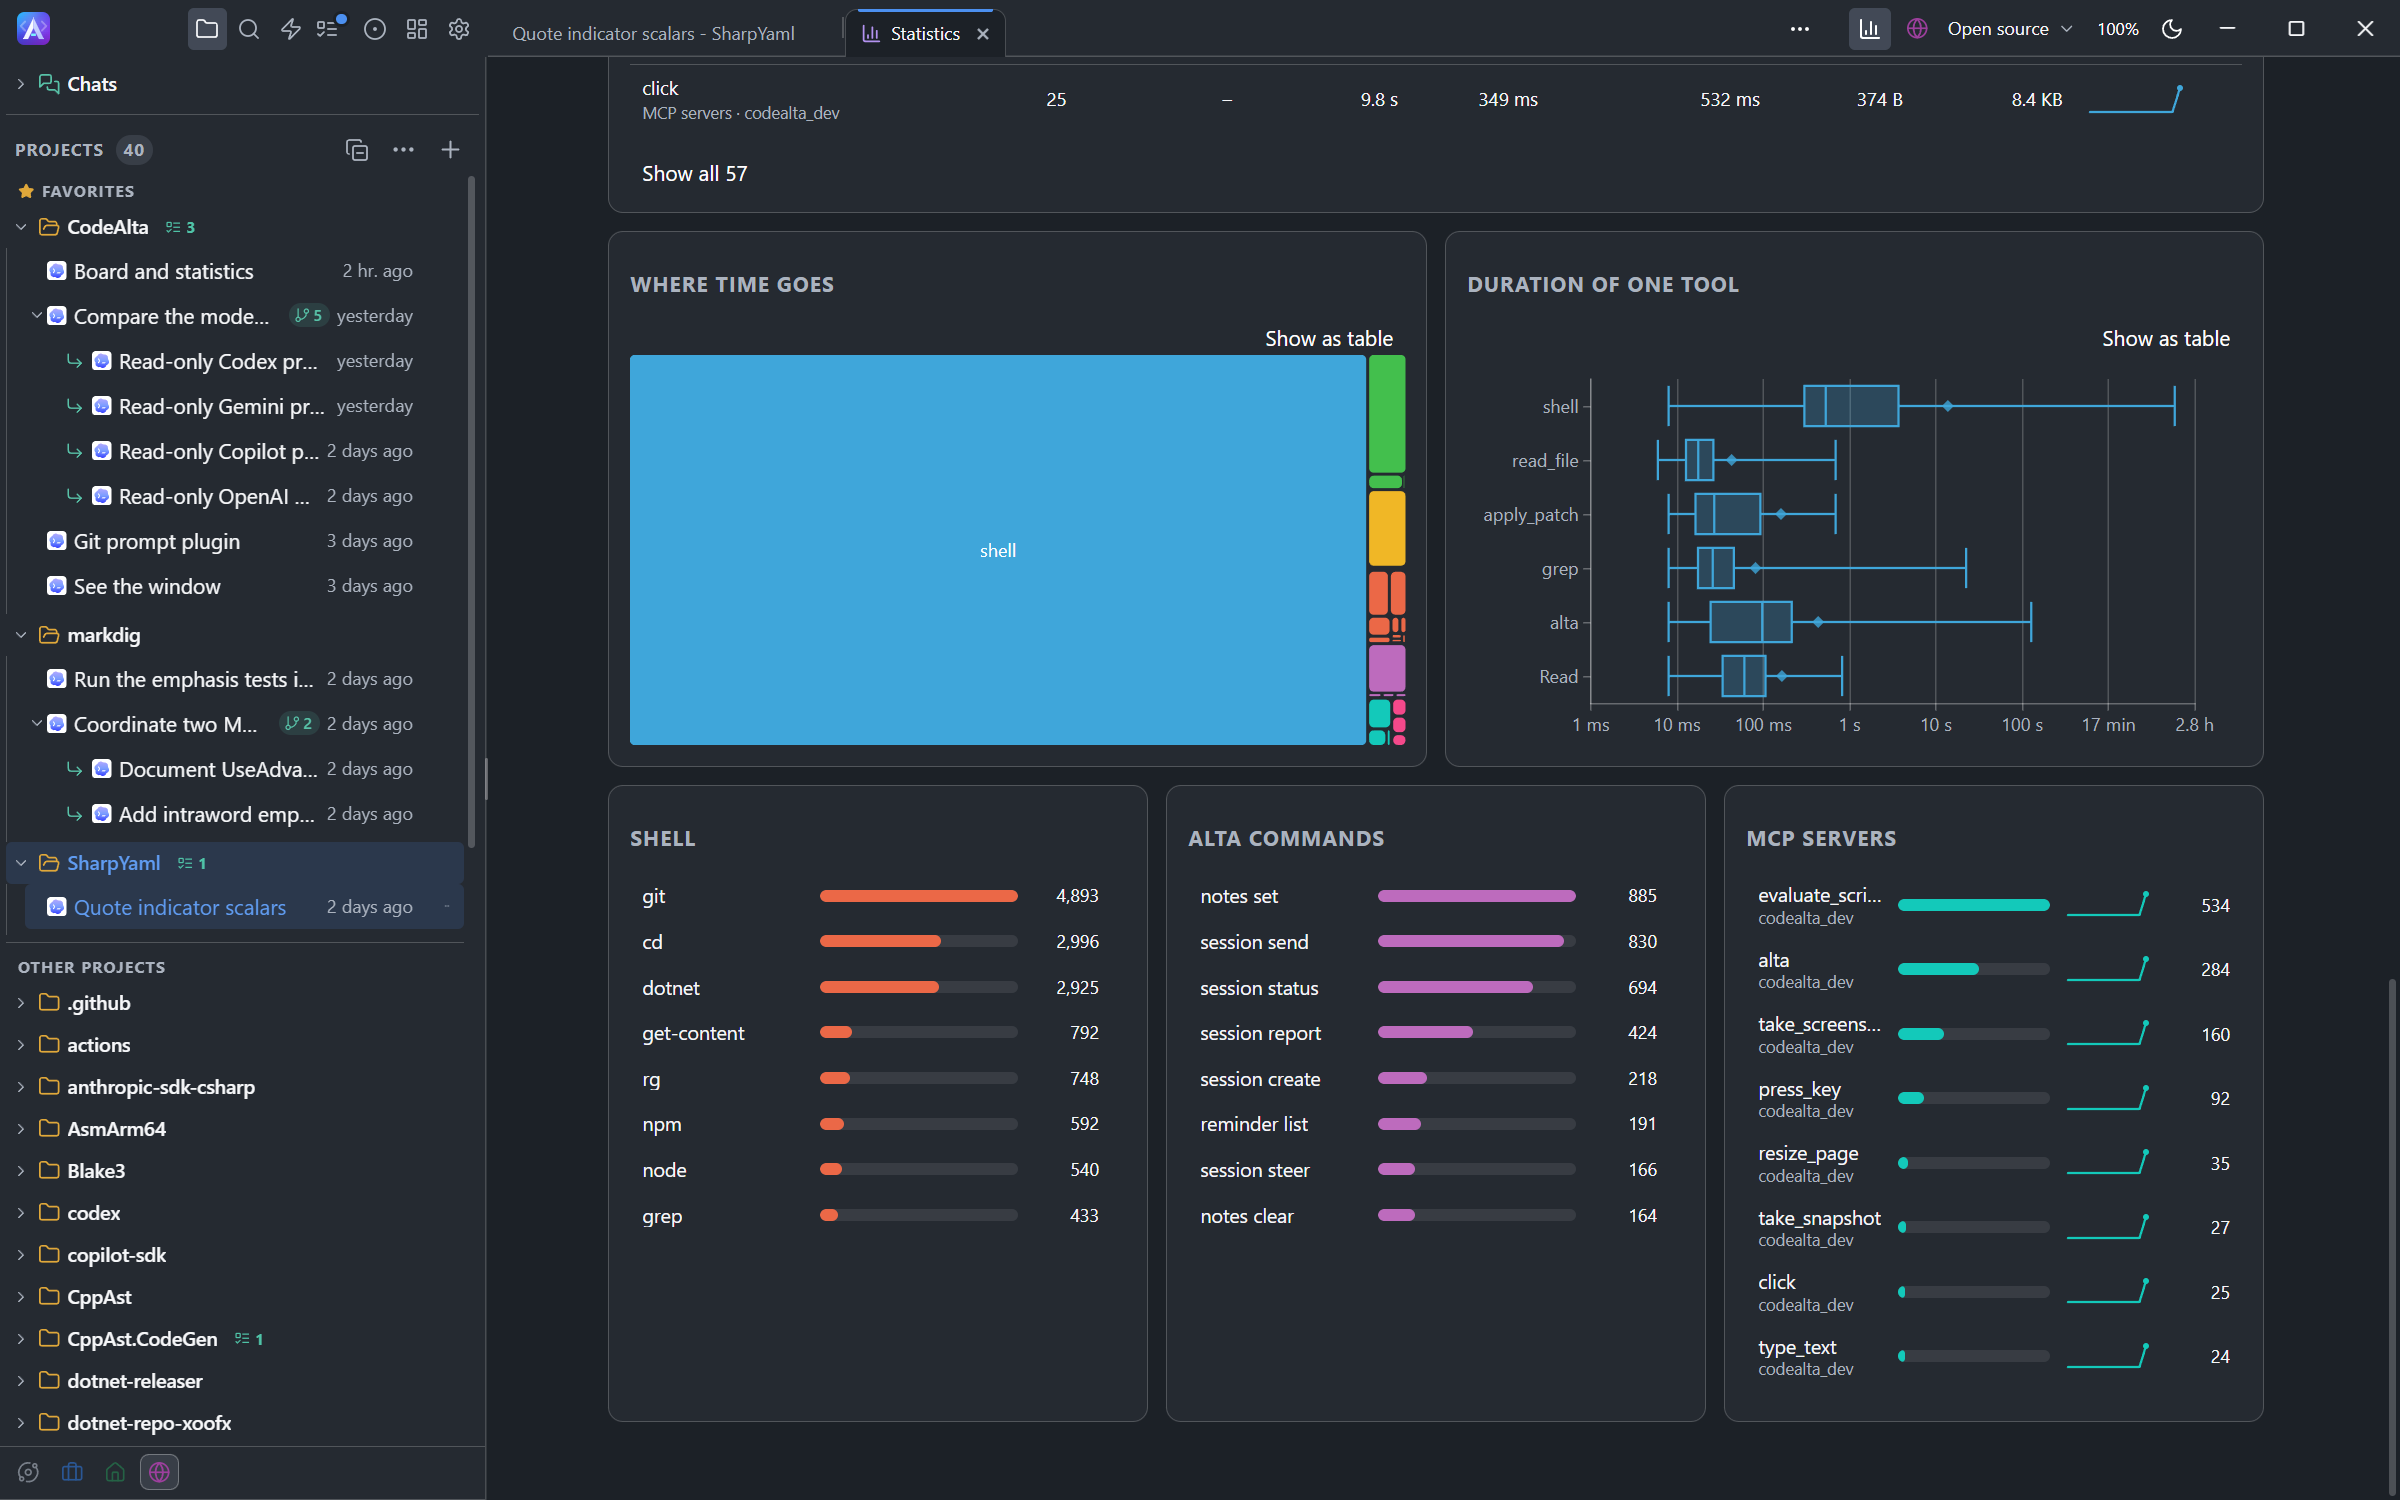
alta commands and the MCP servers.At the end of the Tools page, Skills lists each skill used in the period: its origin (project, yours, CodeAlta, a plugin, Claude Code, or MCP · <server>), its activations, the prompts it was attached to, the reads of its SKILL.md, where it was used and when last. MCP servers counts every MCP tool call, including those through alta mcp tool call. The skills used most recently are listed first in session prompts (see Skills).
The Scripts page counts the runs of Code Mode scripts:
- A run is named by the library script it loads with
workflow("name"). Inline scripts ran only the code sent toexec; Unknown scripts ran before CodeAlta recorded which script it was. - The table gives each script its runs, failures, median and 90th-percentile duration, the sessions it started, and the tokens and cost of those sessions.
- Failing steps and Why runs fail name the step and the error. Only names are kept, never a message.
- Waiting for you is the time scripts waited for your answer or approval.
- Scripts by model and A turn, with a script and without compare the turns that sent a script with the others.
- Recent runs opens the session of a run.
The Tools page counts exec and wait as Scripts and shows how many calls of each tool scripts made. The Agents page shows who started the sessions, scripts included.
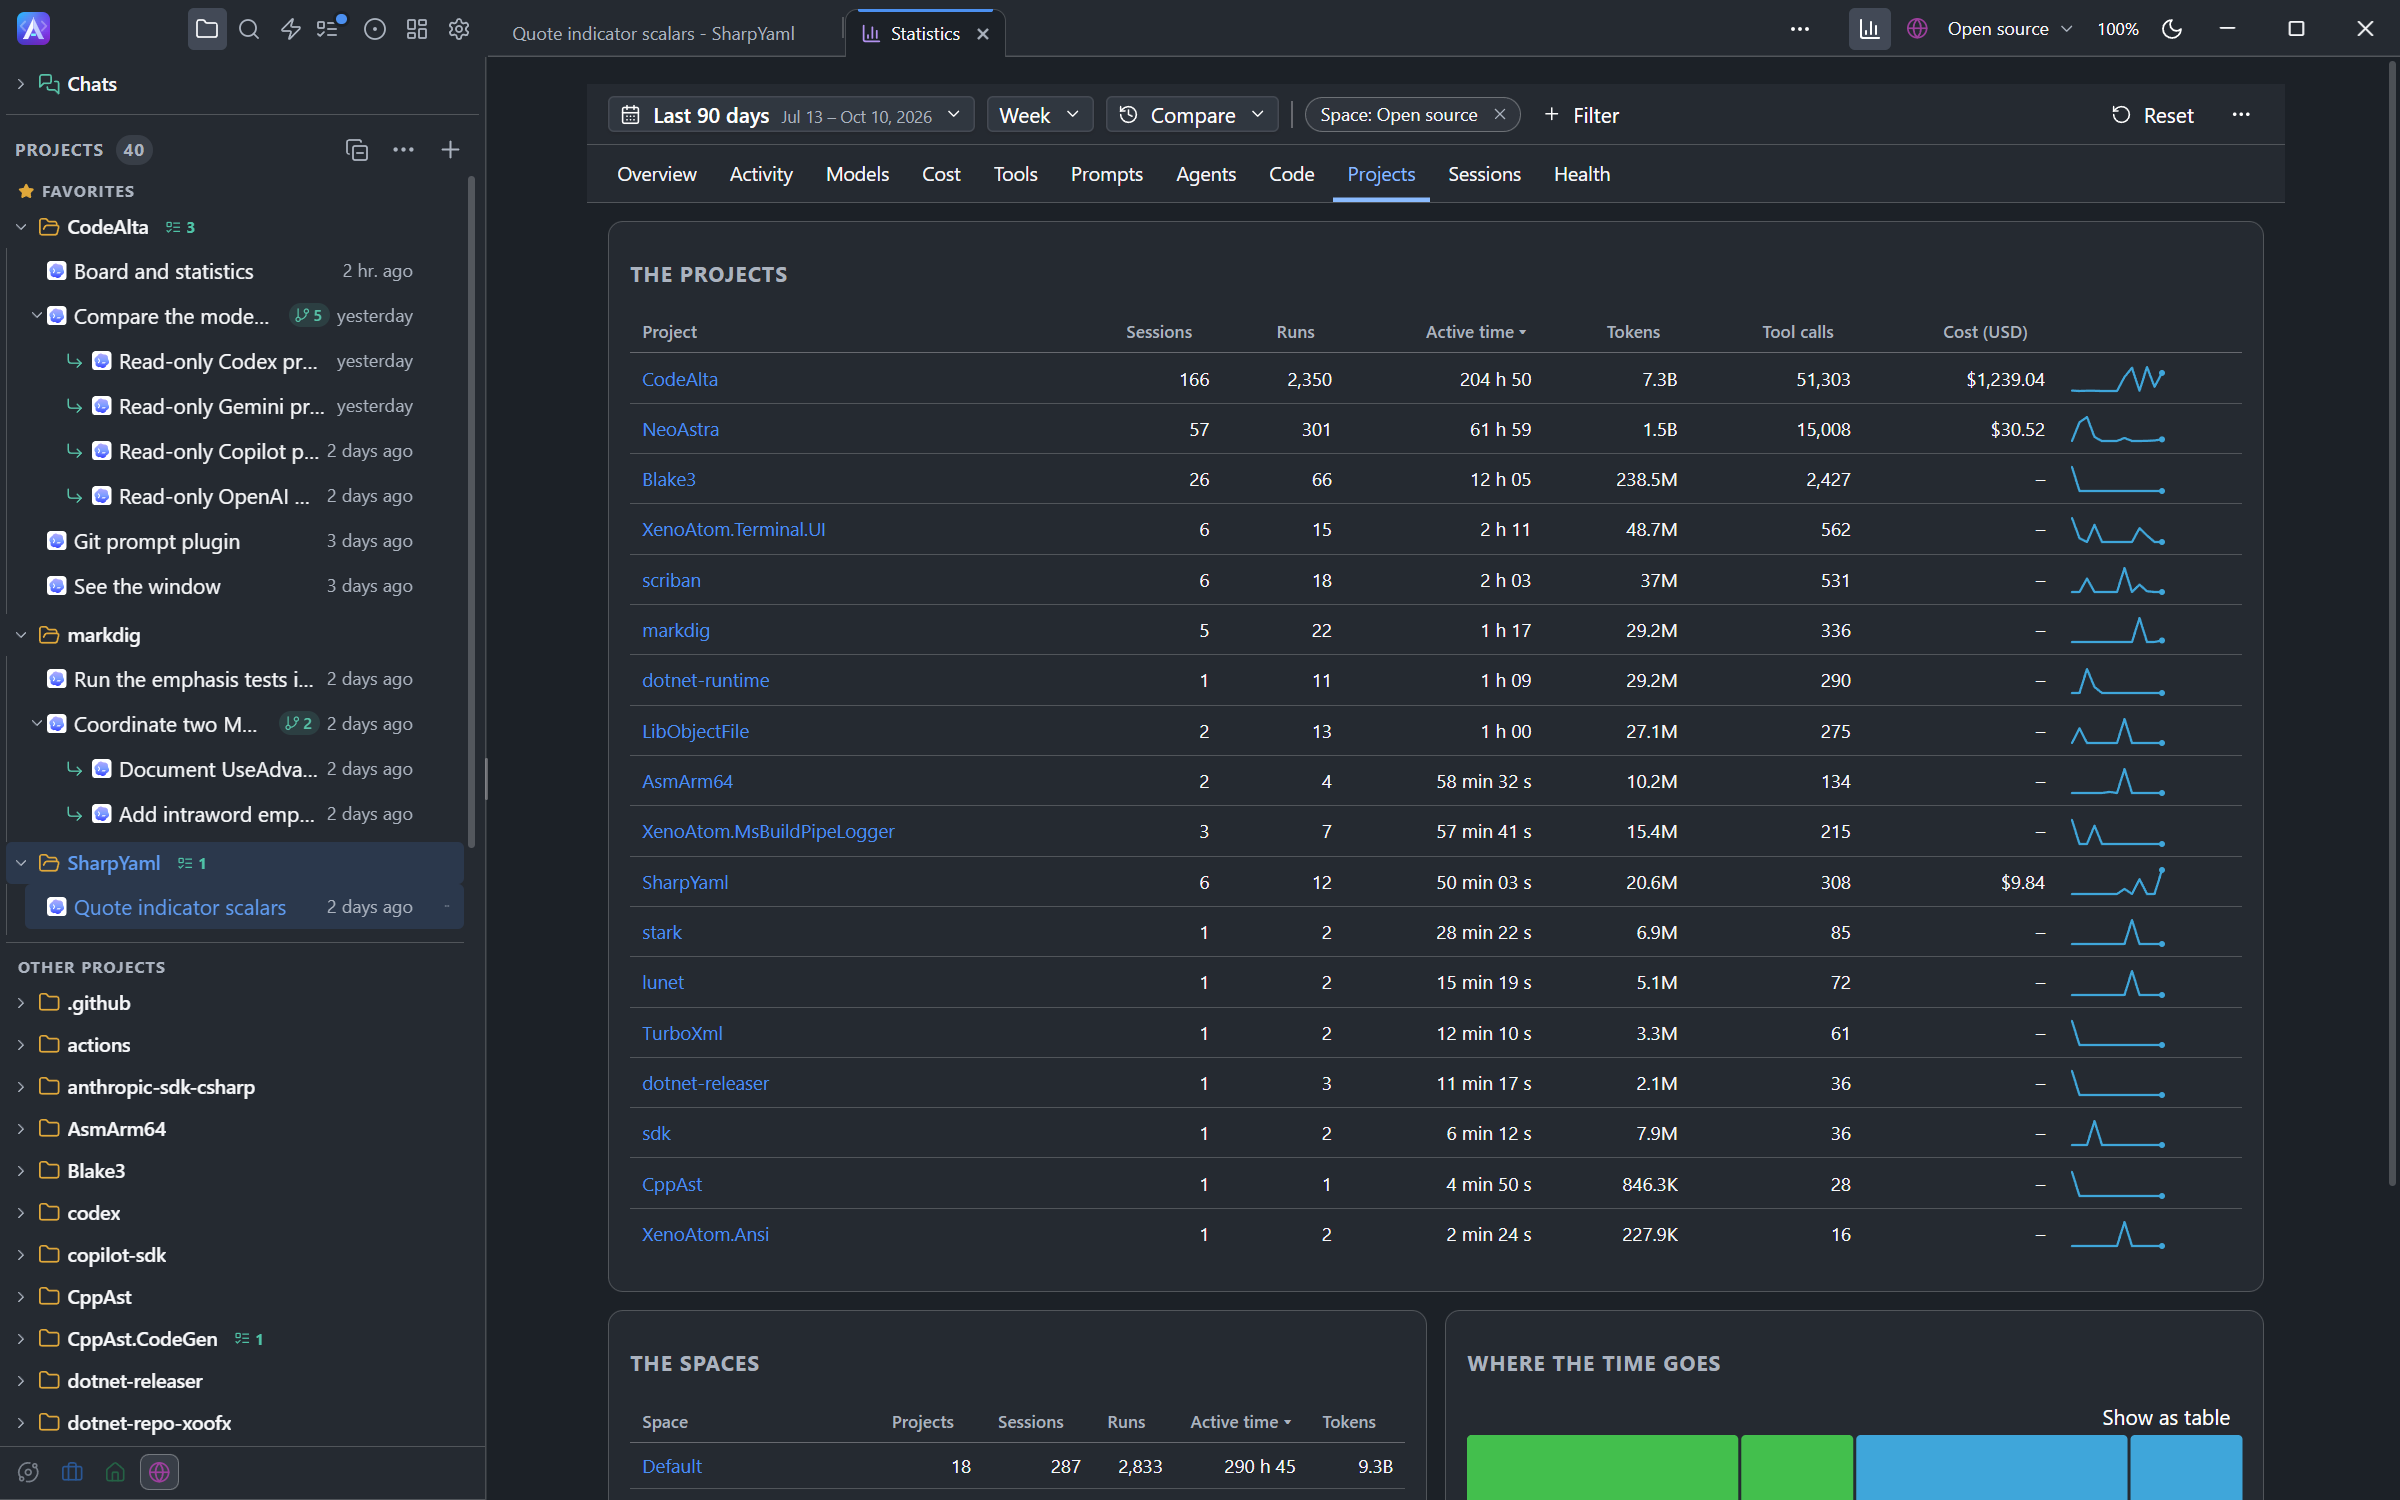
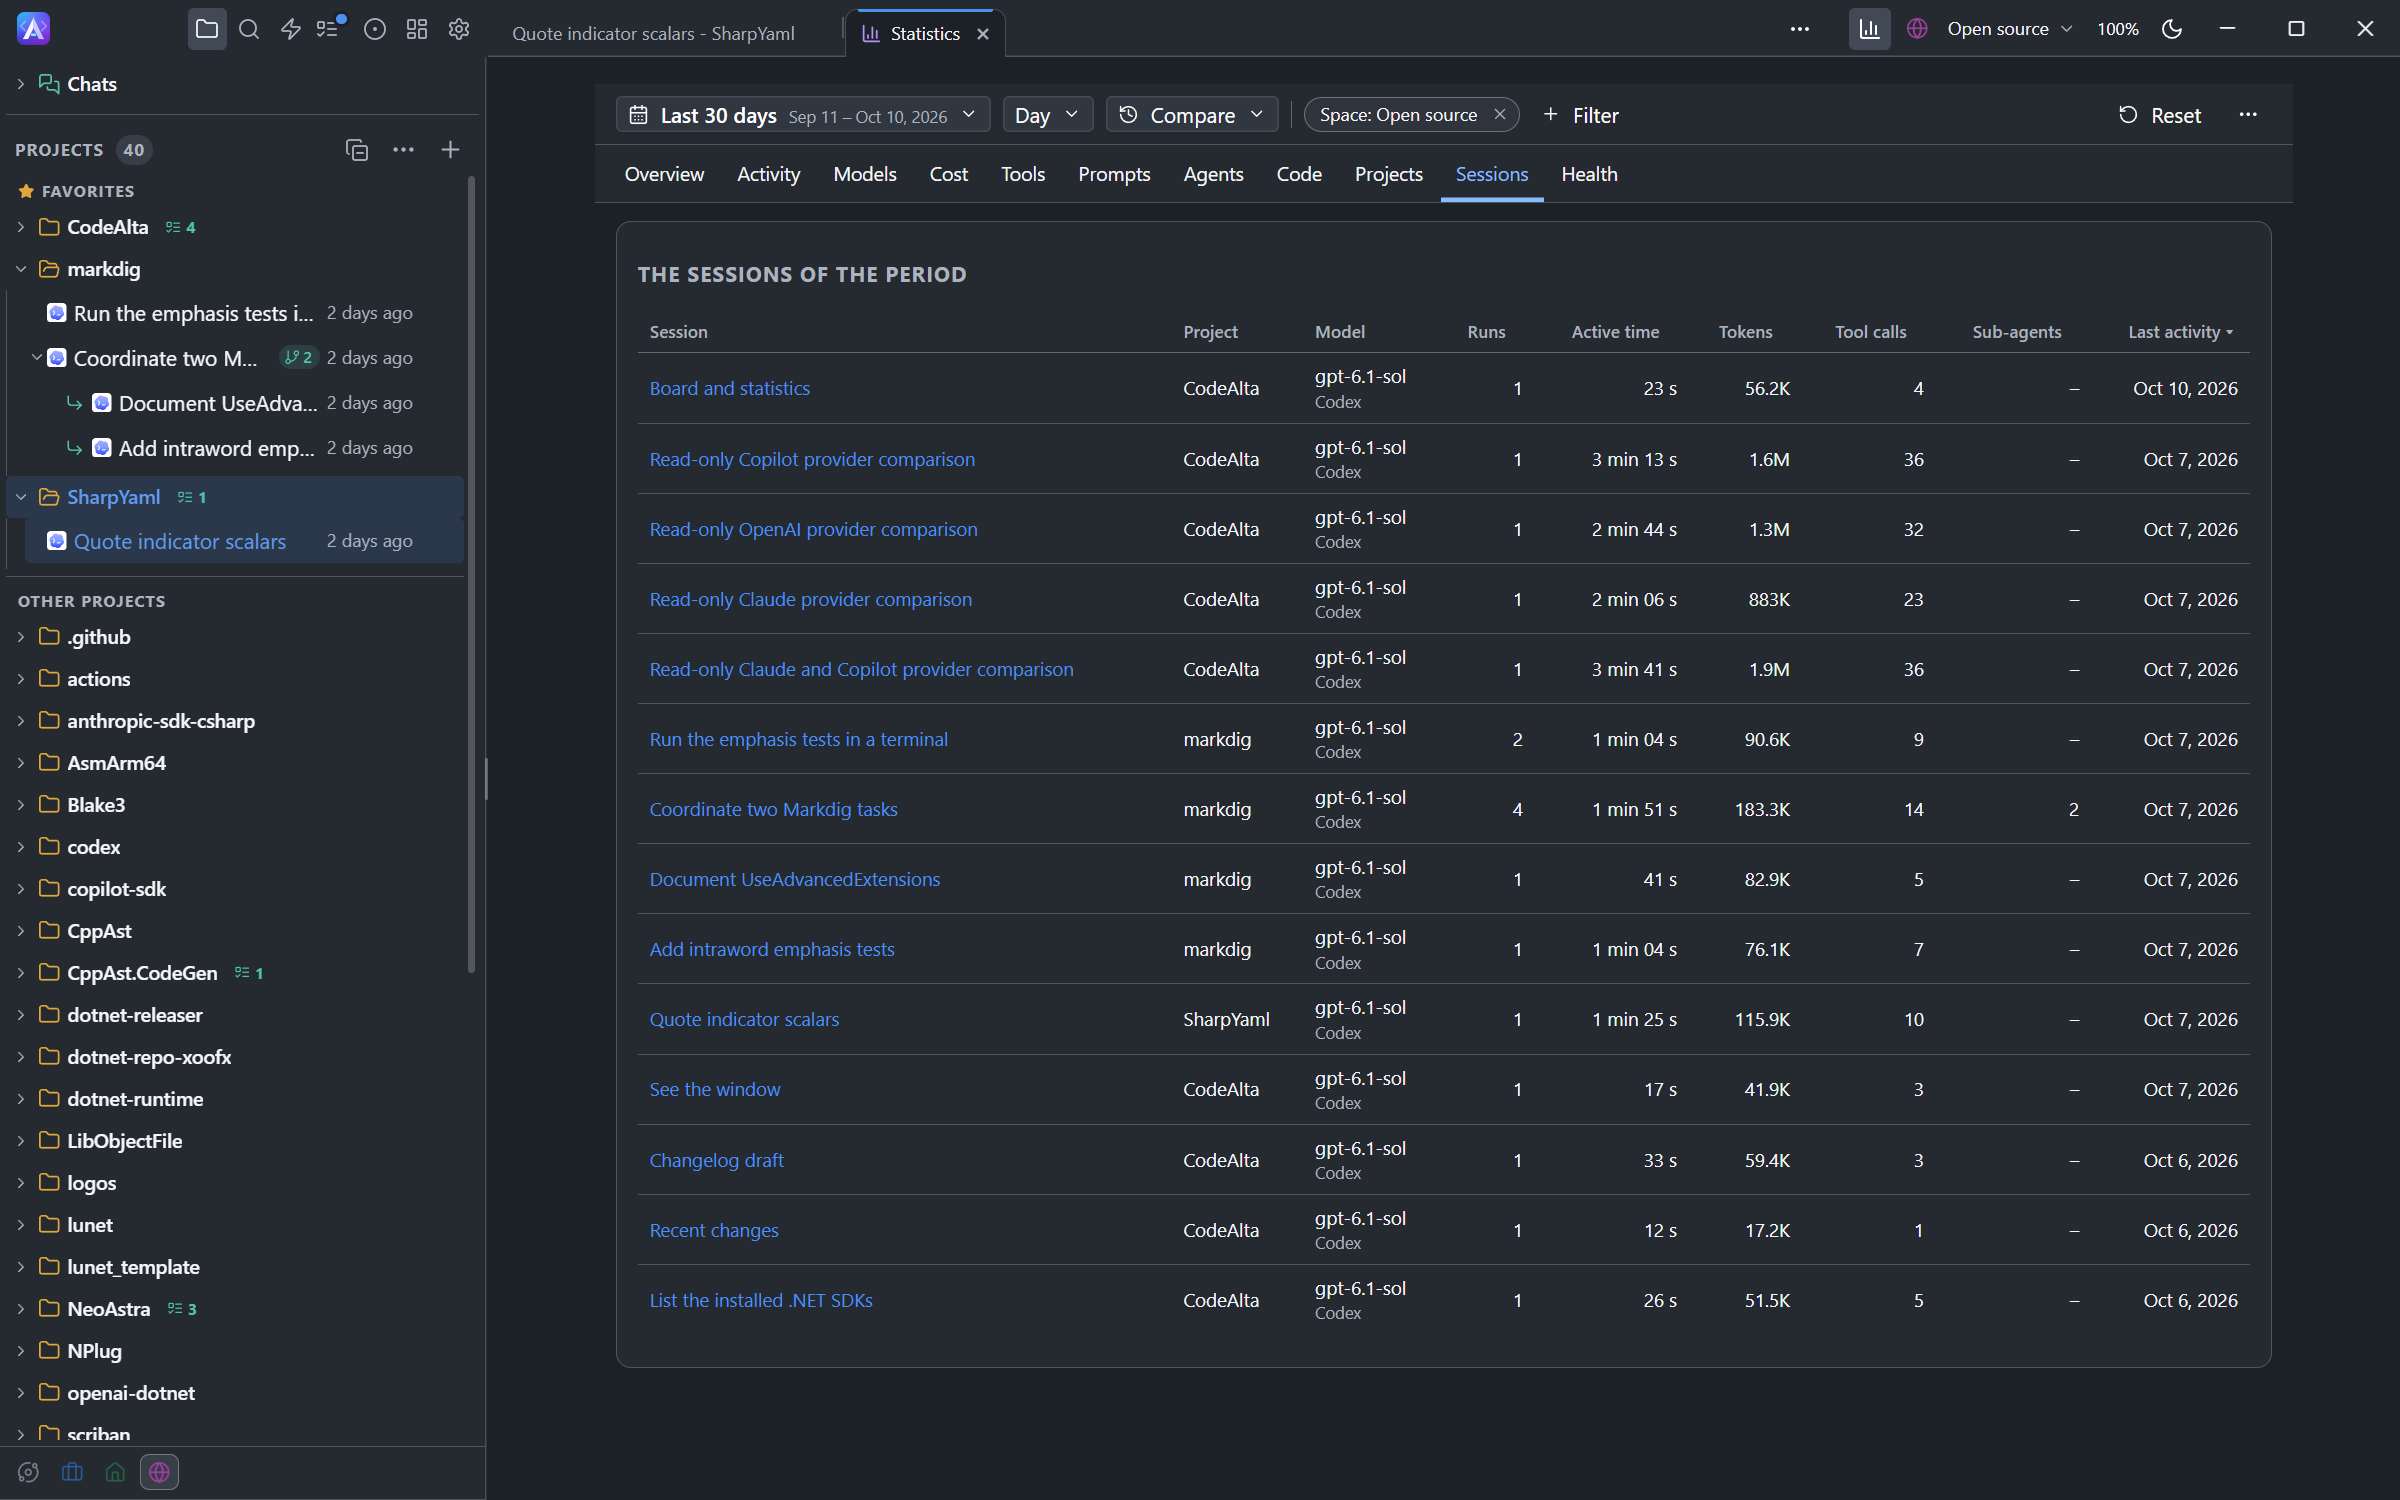
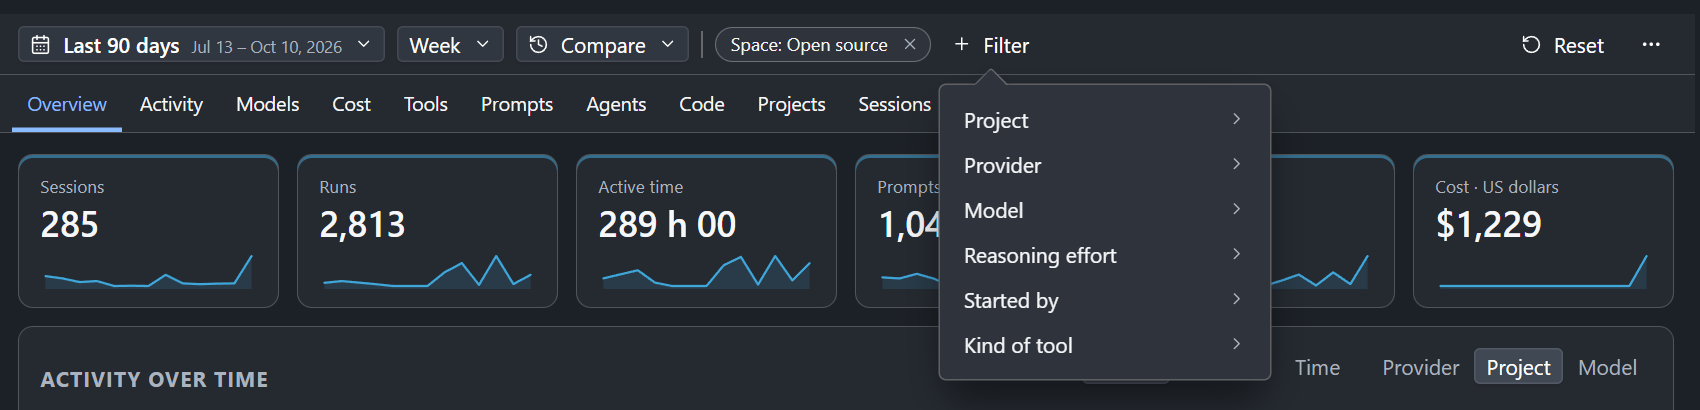
The bar at the top sets:
- the period: today, the last 7, 30 or 90 days, this month, last month, this year, all time, or two dates;
- the frequency: hour, day, week, month, year, or automatic;
- a comparison with the period before, or the same period a year before;
- filters: space, project, provider, model, reasoning effort, who started the work, kind of tool.
A click on a bar, legend entry or row adds a filter; a click on a calendar day shows that day; a drag on the strip under the main chart narrows the period. The page opens on the window's space; removing that filter shows all spaces.
- Every chart can be shown as a table, and legends and menus work with the keyboard.
- Costs are shown per unit (dollars or AI credits), never added together. An estimate from public prices is a separate block, marked as such.
- Context fill shows a measured 0%; a gap means no window size was reported. When some parents are unknown, sub-agent depths read at least.
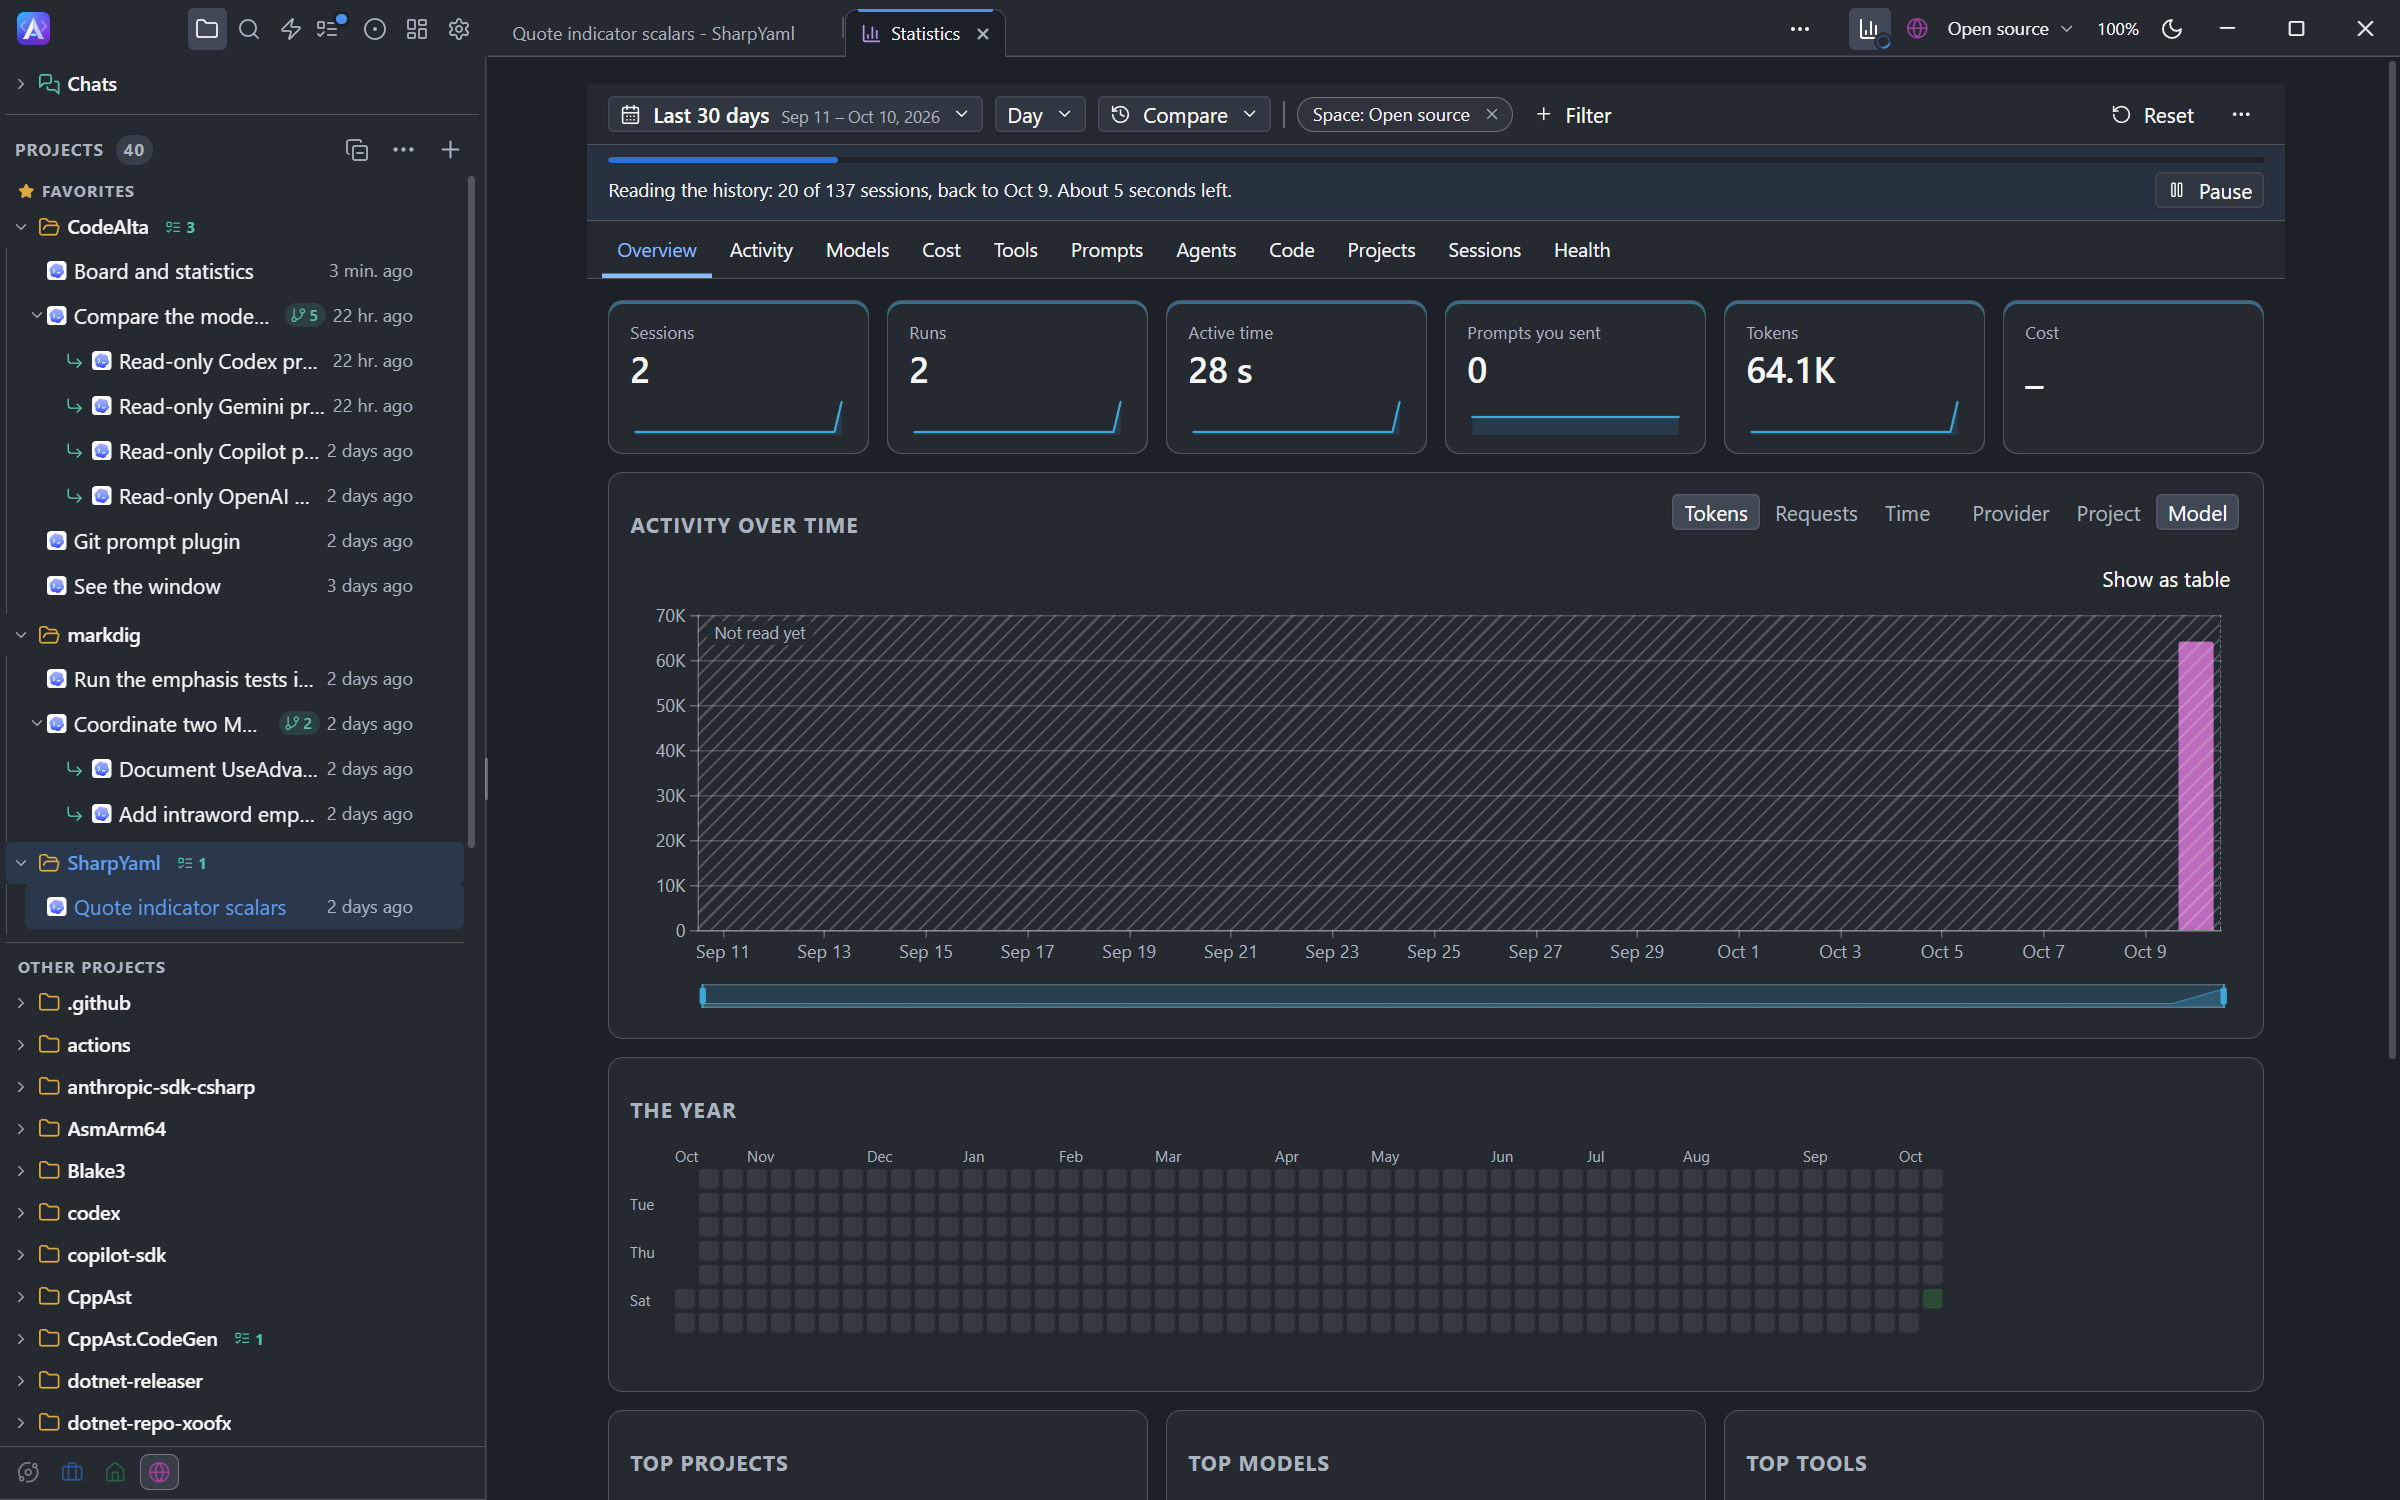
While history is read, the page is usable: recent days come first, unread days are hatched, and a bar shows progress and time left, with Pause, Resume and Stop here. The page menu reads more history, forgets deleted sessions, and resets the statistics after asking.
Ask an agent
Agents read the same numbers with alta statistics:
How much did I use CodeAlta this week compared with the week before? Give the tokens and the active time.
Which tools take the most time in the CodeAlta project over the last 30 days?
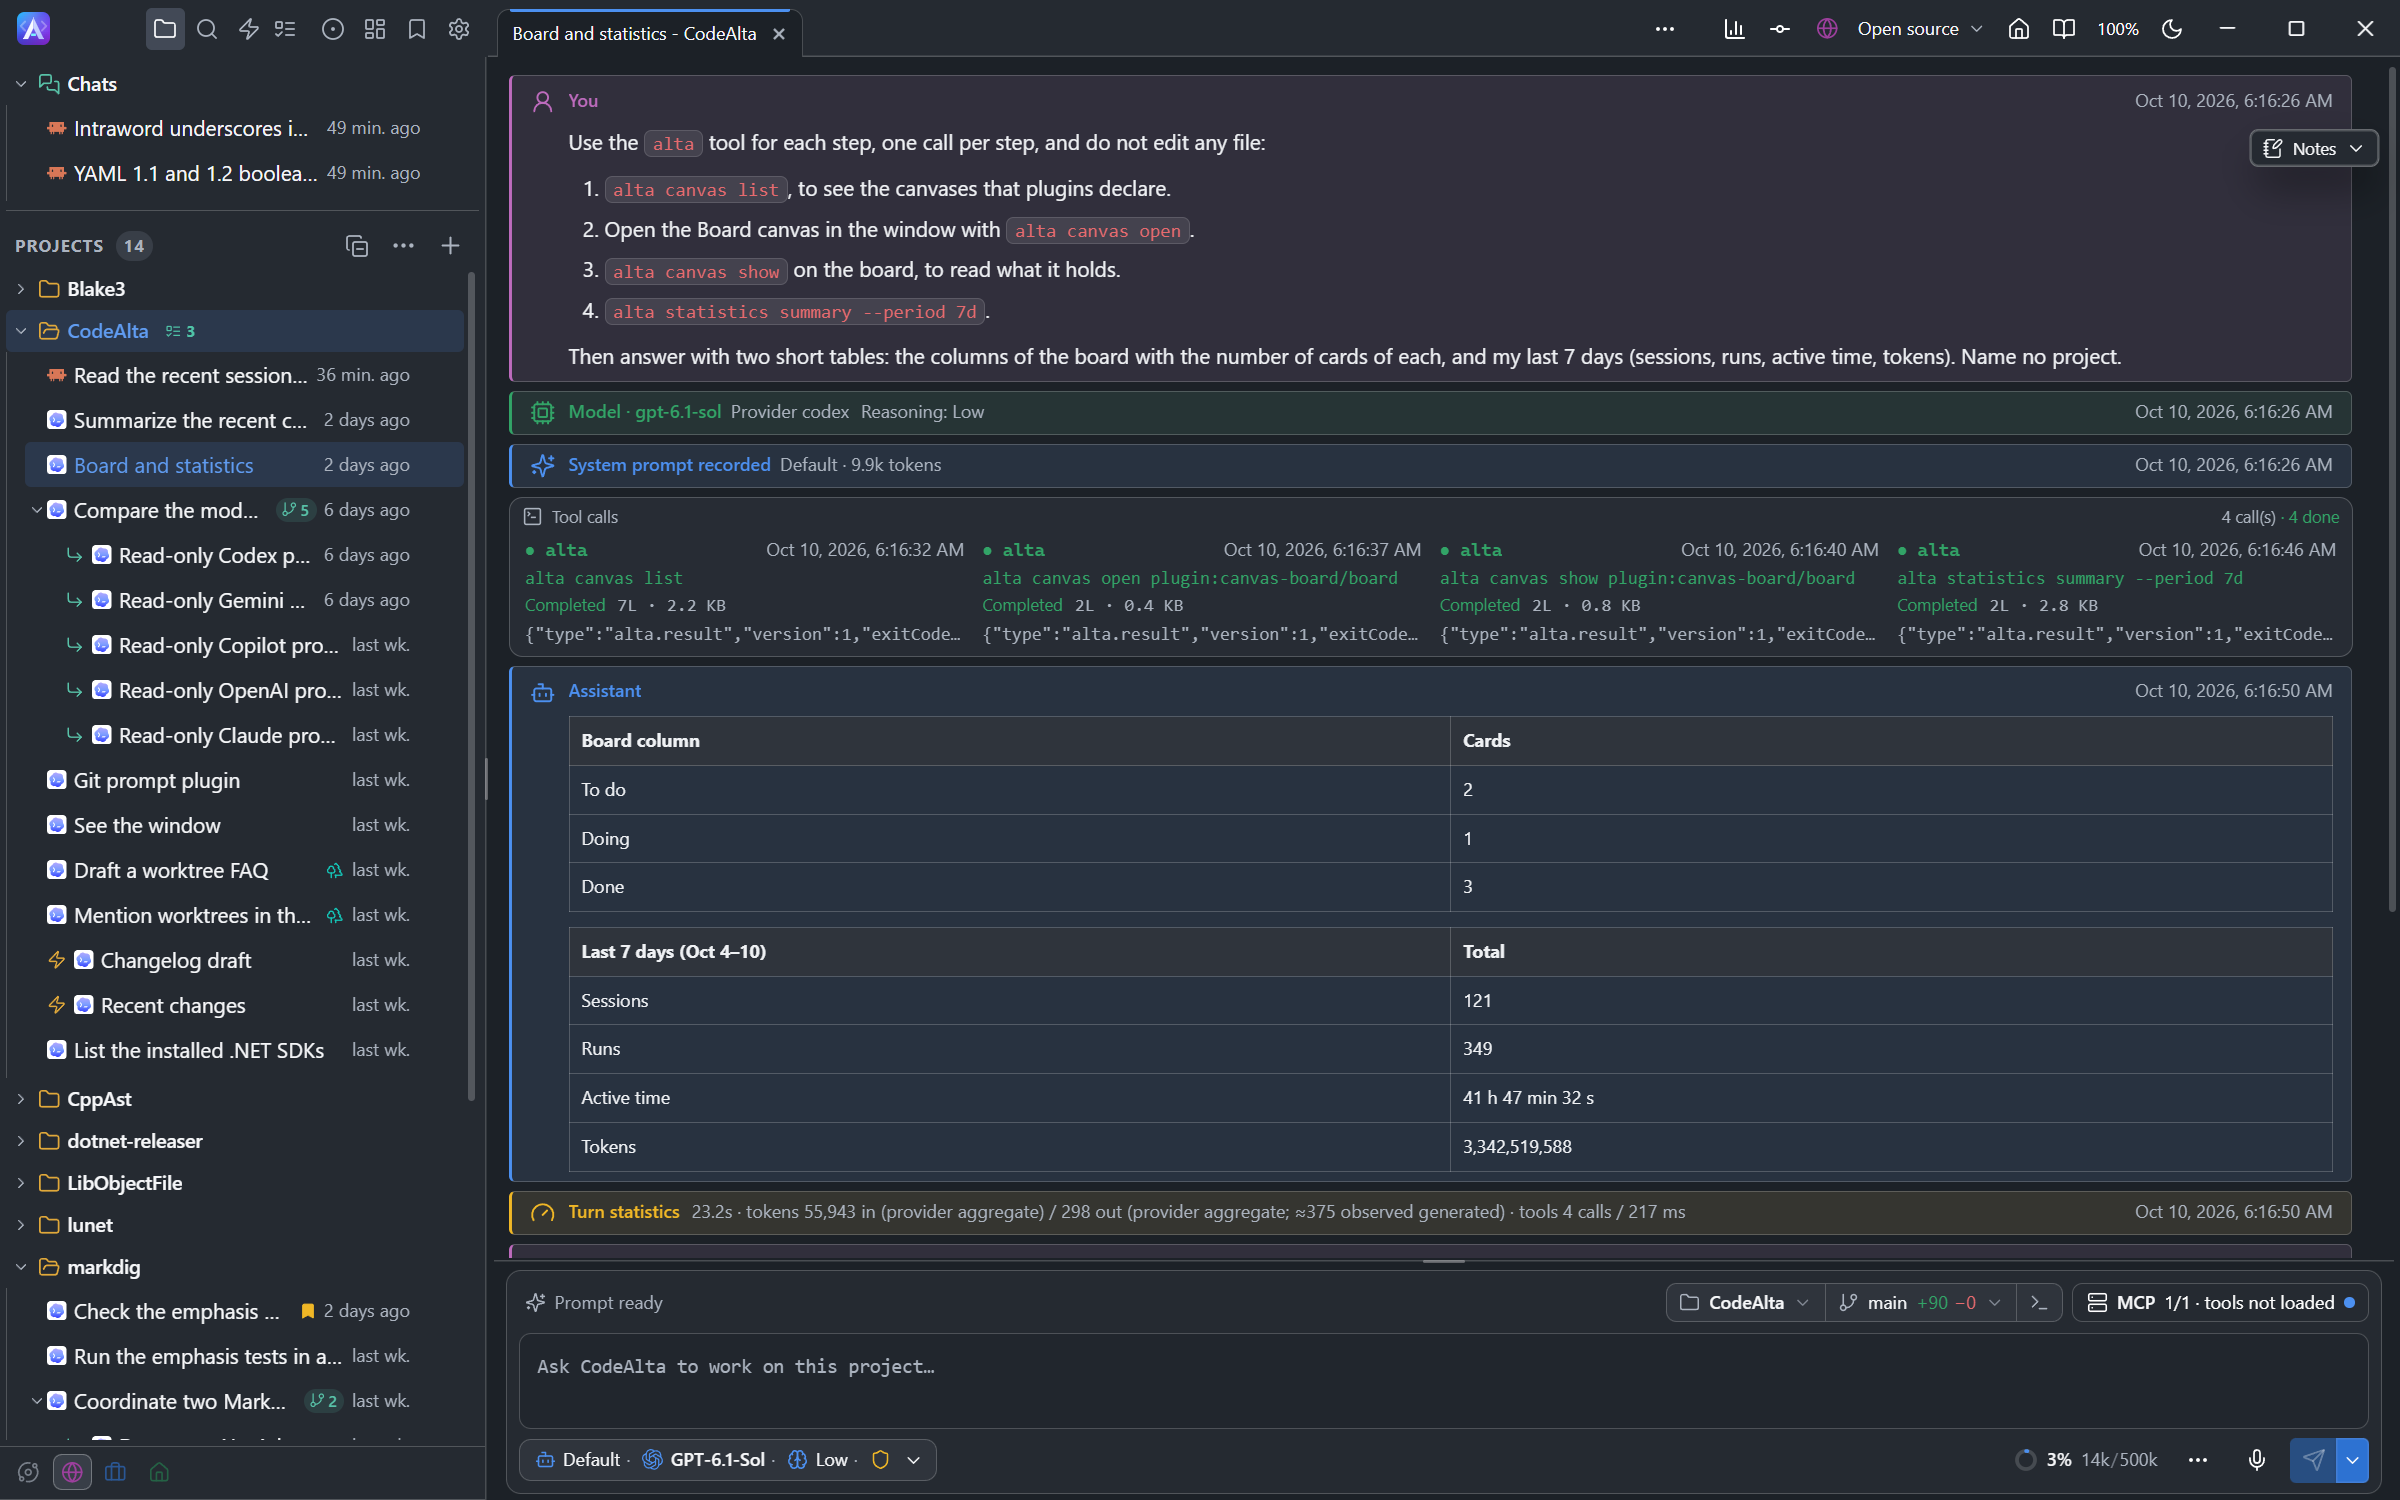
alta, and answers with the numbers.| Command | What it answers |
|---|---|
alta statistics summary |
A period at a glance, compared with the period before |
alta statistics series <metric> |
One metric over time, optionally by provider, model, project or tool. Includes sessions-at-once and context-fill |
alta statistics top <tools\|models\|projects\|sessions> |
A ranking by tokens, time or calls |
alta statistics details <list> |
Shell programs, alta commands, file kinds changed, sub-agent-depth, prompt-provenance |
alta statistics skills |
Skills used, with their uses and sessions |
alta statistics mcp |
MCP tools called, and calls per server |
alta statistics scripts |
Runs of Code Mode scripts: outcomes, each script, adoption by model, latest runs. details script-step-failed and details script-error name what failed |
alta statistics session <session> |
One session, with its sub-agents when asked. --session (and --with-children) works on summary, series, top and details |
alta statistics status |
How far the history is read |
alta statistics history ... |
Choose, pause, resume or stop reading history, or forget deleted sessions |
alta statistics estimate <text> |
Size of a text in bytes and approximate tokens |
- A period is
today,yesterday, a number of days (7d,30d,90d, today included),week,month,last-month,year,all, or two dates. - Days are local; a week starts on the first day of your regional settings.
- A space filter uses the projects the space has today.
- A run spans its first to last record, including time waiting for you; sessions at once are those with a run open at the same moment.
- Every answer says whether the history is fully read for the period.
Disable it
[plugins.statistics]
enabled = false
Nothing is read or updated while the plugin is off. The kept numbers stay in the database and are used again when you turn it back on.